Correlated mechanical microscopy using nanoindentation and EBSD is a powerful technique for materials science investigations. This allows the extraction of orientation-property relationships, which are a fingerprint of the metal’s plastic and elastic anisotropy. FCC metals are largely plastically isotropic, due to their large number of available slip systems. However, they still possess elastic anisotropy. In this application note, correlative mechanical microscopy with EBSD is used to determine the elastic anisotropy of pure Nickel. This demonstrates the high sensitivity of displacement-controlled nanoindentation mapping, which provides property distributions that are a function of crystallographic orientation rather than statistical variation.
Introduction
Mechanical Microscopy generates a large amount of statistical data during the performance of nanoindentation maps. These are often fit using statistics, clustering or machine learning algorithms to identify a single representative value within a phase’s distribution [1]. This is often necessary for many other nanoindentation systems, as there can be very large scatter in the data due to their relatively low sensitivity during high speed nanoindentation mapping. In this application note, we will demonstrate that this is not the case for our systems. Instead, we will show that the variation within these distributions can be directly related to the crystallographic orientation of the individual grains within a sample of polycrystalline Nickel.
To do this, correlative mechanical microscopy is performed by combining electron back-scattered diffraction (EBSD) and nanoindentation mapping on the polycrystalline microstructures . This provides information on both the plastic and elastic anisotropy of the materials, which provides a fingerprint of the metal’s deformation mechanisms, providing that the region of the microstructure contains the full range of crystallographic orientations, i.e. a random texture.
In this application note, nanoindentation and orientation mapping are used to perform correlative mechanical microscopy on cast, polycrystalline pure Nickel sample. An indentation technique employing continuous stiffness measurement (CSM) is used, providing sufficient precision to determine reduced modulus as a function of orientation. Details of the approach are described, particularly the system concerns, and the ability of the correlative approach to identify grains and trends in both elastic and plastic anisotropy is demonstrated and discussed. Finally, this is compared to the theoretical elastic anisotropy calculated using the model of Vlassak and Nix [2] to validate the measurements.
Experimental Considerations
To perform correlative mechanical microscopy, the sampled volumes measured by both techniques need to be similarly and regularly sized. For nanoindentation, this means that testing should be performed under displacement control, so that every indentation is made to the same maximum depth regardless of that phase’s or orientation’s properties.
Displacement Control
Displacement-controlled indentation mapping is highly preferable for correlative applications. In load control, the load must be carefully chosen to ensure that the spacing is proportional to the indentation produced in the softest phase in the map. Otherwise, indentations in the soft region will overlap with its neighbors. This means for indentations maps performed in load control, a significant disparity in indentations depths and spacings can be expected for maps over dissimilar phases.
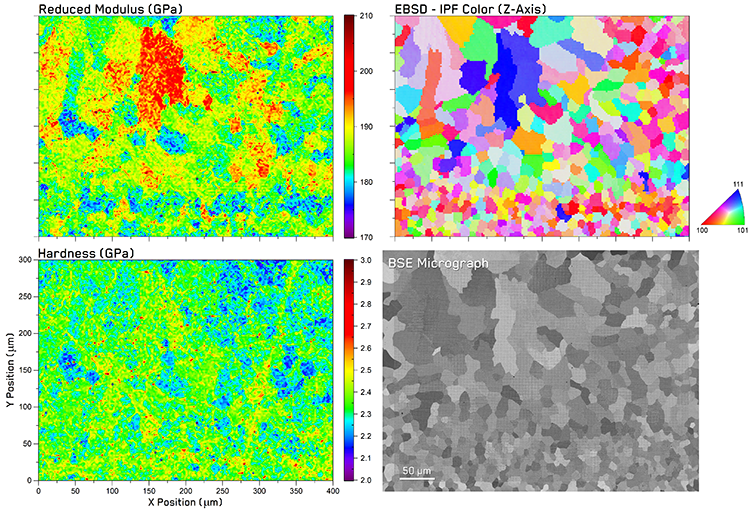 Figure 1. Mechanical microscopy results from suction-cast, pure Nickel with correlated indentation property maps with EBSD orientation and backscattered electron micrographs of the same region.
In displacement control, indentations are all performed to the same maximum depth, ensuring similar indentation sizes and regular with minor variations from differences in elastic recovery. This is important for correlative measurements, so that every mechanical and analytical measurement is taken from the same volume of material.
Experimental Procedures
A pure nickel rod (99.97 wt.%, Alfa Aesar GmbH & Co KG) was prepared by suction casting inside an arc melter (MAM-1, Edmund Bühler GmbH) under high purity Ar (5N grade) atmosphere, with a Ti-getter to reduce contamination traces. The resulting button was flipped over and remelted several times to ensure homogeneity. The casting into rods of 3 mm diameter was done by arc melting the button and pulling the melt into a water-cooled copper mold by suction casting. The rod was sectioned transverse to the long axis of the rod and mounted. The sample was then mechanically ground and metallographically prepared and polished using progressively finer abrasives until a final polish achieved using a 50 nm alumina suspension.
Nanoindentation mapping was performed using an i04 Femto-Indenter equipped with an FT-S20,000 sensor and a diamond Berkovich tip. Each indentation was performed using continuous stiffness measurement (CSM) method [3] in displacement control. An oscillation frequency of 150 Hz and a proportionally scaled amplitude that linearly increased from 0.5 to 2.5 nm with increasing depth was used. A map of 200×150 indentations was performed with a maximum depth of 190 nm and a 2 µm spacing. This ensured an indentation depth/spacing ratio of 10 was maintained [4]. Representative values for each indentation were determined from the mean of values measured at contact depths above 50% of the target depth for elastic modulus and 80% for hardness to minimize errors from indentation size effects.
Microstructural analyses were performed using analytical SEM, backscattered electron (BSE) imaging, and EBSD mapping Hitachi SU-5000 (Oxford Symmetry 2). EBSD measurements were performed at 20 kV with a step size of 1 μm and using a 4×4 binning and averaging of 2 frames. Noise reduction was performed using 5 nearest neighbors. Electron micrographs were taken of the test region with a Zeiss EVO 25 SEM at 10 kV using a HD Backscattered Electron Detector (BSE).
Point-to-Point Correlation
To achieve point-to-point correlations between nanoindentation, EDX, and EBSD measurements, a dedicated Python library ‘PyXC’ was developed. The library corrects systematic distortions that occur with various measurement methods, aligns the data layers to a reference image and queries the data by an arbitrary X or Y coordinate. This open-source library is now available online: https://zenodo.org/record/8322342.
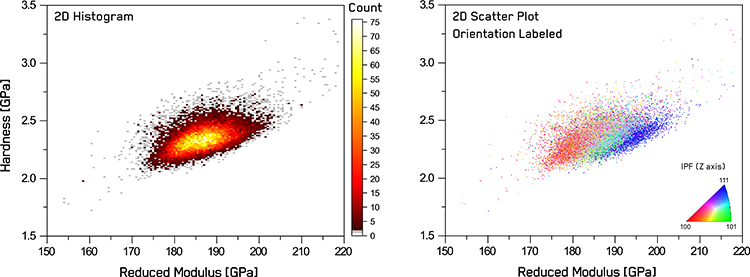 Figure 2. Statistics of correlated mechanical property distributions: 2D histogram of hardness vs reduced modulus and 2D scatter plot with datapoints color coded using correlated EBSD data.
Full details on the developed correlation procedure and methods for extraction of elastic tensors from correlated data are presented in an article in Materials & Design [5].
Results
Correlated Maps
The results of correlative nanoindentation and EBSD mapping are shown in Figure 1. Excellent visual correlation is observed between the reduced modulus, Er, BSE micrograph, and EBSD maps in both morphology and scaling, as well as with the morphology of the BSE micrograph of the region.
By eye, several different types of grains show prominence within the EBSD map. A pair of large dark blue, [111]-oriented grains are observed in the middle of the region, which corresponds to the red, high modulus grains within the reduced modulus plot. A line of finer, [100]-oriented, red grains appears across the bottom of the EBSD map, and these correspond to low modulus, blue grains in the reduced modulus map.
The hardness map and BSE micrograph show similar morphology to the reduced modulus and EBSD maps, but the intensities in these maps do not as directly correspond to the orientations or moduli of the grains in all cases. The grains which are near the [100]-orientation do appear to have the lowest hardness, H, and several of the [111]-oriented grains appear to have higher hardness. Some evidence of subsurface hardening from polishing scratches is observed in the hardness map, which is not observable in the other maps.
Correlated Property Distributions
As hardness and elastic modulus are interrelated properties, 2D histogram plots are often utilized to display the statistical distributions of the obtained H and E values over the entire mapped region simultaneously. This type of plot shows the number of indentations fitting within a fixed bin of H and E values, such that phases appear as clusters or peaks. In the 2D histogram in Figure 2, we see that the polycrystalline Nickel appears as a single cluster with a broad distribution.
However, if we use the correlated results from EBSD, to color-code the data as a function of the crystallographic orientation, as shown in the 2D scatter plot in Figure 2, then we can see the reason for the broad distribution is the range of crystallographic orientations included in the mapped region. This plot of indentation properties and orientation represents a unique way of simultaneously showing both elastic and plastic anisotropy relationships with crystallographic orientation in a material or a fingerprint of its deformation behavior. The shape of the distribution depends on the relationship between elastic and plastic anisotropy, while the coloring indicates the relationship of this anisotropy to the crystallographic orientation. The distribution is mostly oblong, oriented along a single H/E ratio, as seen previously in FCC materials [6]. However, this current work reveals that the hardness and modulus increase along this H/E axis smoothly as a function of crystallographic orientation with the minimum at the [100] and a maximum at [111] orientations.
Discussion
In nanoindentation testing [3], the measured reduced modulus of the sample, Er, is a function of the elastic properties of the indenter (EI, νI ) and the Posson’s ratio of the sample, :
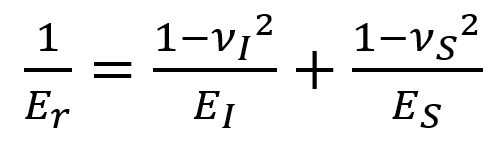
This is why we usually report the reduced modulus, Er, in mechanical microscopy as the local Poisson’s ratio of the material is not often precisely known or may vary with the local material, phase, or orientation.
However, to compare the measured elastic properties of the Nickel as a function of orientation with the literature, it is necessary to determine what the theoretical moduli would be as a function of orientation from the elastic constants of the material. For the directional elastic moduli, Ehkl, this is a straightforward exercise in tensor mathematics described in detail elsewhere [7]. However, this yields the uniaxial elastic modulus in that direction, not the triaxial indentation modulus, which shows significantly smaller anisotropy.
To determine the reduced indentation modulus for the (001), (011), and (111) planes’ normal directions, the Vlassak-Nix model [2] for cubic materials was used:
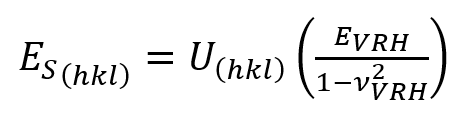 where EVHR and νVRH are the Voigt-Reuss-Hill (VRH) average values [8] and the correction factor U is given by
 The terms a, c, A0 and B denote fitting parameters which are valid for a fixed Poisson´s ratio, ν<001>, given in the V-N model [2] and the term A reflects the Zener anisotropy ratio [9].
The Voigt-Reuss-Hill average values EVHR and νVRH were calculated from literature stiffness tensors, Cij, for pure Nickel given in Table 1. The equations above were used to determine the directional indentation modulus, which was then converted to reduced modulus using the first equation with EI = 1140 GPa and = 0.07 for the diamond indenter. The resulting values for Er(001), Er(011), and Er(111) are plotted in Figure 3.
|
C11
|
C12
|
C44
|
EVHR
|
νVRH
|
ν<001>
|
Reference
|
|
253
|
152
|
124
|
224.6
|
0.298
|
0.375
|
Ledbetter [10]
|
|
247
|
153
|
122
|
217.0
|
0.304
|
0.383
|
Hearmon [11]
|
|
244
|
158
|
102
|
191.7
|
0.329
|
0.393
|
Yamamoto [12]
|
Table 1. Elastic constants and Poisson’s ratios derived from the literature [10-12].
The orientation-dependence or anisotropy in hardness and reduced modulus for pure nickel is plotted as a function of declination angle, β (the second Euler angle, measured by EBSD), in Figure 3. In FCC metals, we observe a relatively weak linear trend in hardness as a function of declination angle, due to the large number of available slip systems reducing the effective anisotropy. The increasing linear trend is attributed to the complex relationship between hardness and modulus, such that the increasing modulus with declination angle results in a slightly higher hardness value. BCC and HCP metals with more complicated slip behavior show significantly more variation with orientation.
![Orientation-dependence of hardness and reduced modulus of pure Nickel as a function of declination angle with datapoint color-coded using correlated EBSD data, along with reduced modulus trends derived from the literature [10-12].](https://www.oxinst.com/learning/uploads/inline-images/ni-an21-fig3-750-20250528123603.png) Figure 3. Orientation-dependence of hardness and reduced modulus of pure Nickel as a function of declination angle with datapoint color-coded using correlated EBSD data, along with reduced modulus trends derived from the literature [10-12].
Figure 3. Orientation-dependence of hardness and reduced modulus of pure Nickel as a function of declination angle with datapoint color-coded using correlated EBSD data, along with reduced modulus trends derived from the literature [10-12].
If we compare the measured trend in reduced modulus versus declination angle with the values determined using the Vlassak-Nix model from the literature elastic constants, we observe good agreement in both absolute values and vs. β slope. Absolute values of the elastic constants vary significantly in the literature [10], depending on the production method and state (e.g. cold-worked or annealed) of the Nickel crystals. The precision of this correlated mechanical microscopy measurement is also sufficient that it could be used for an inverse determination of the elastic constants of the material, as shown in previous work [5].
Conclusion
The application of correlative mechanical microscopy with EBSD was successfully demonstrated on polycrystalline pure Nickel. Excellent correlation was observed between the various imaging modalities employed: indentation, BSE, and EBSD. Similar trends were observed between the orientation and nanoindentation results as in 316L stainless steel with the lowest values occurring near the [100] orientation increasing with declination towards the highest values near the [111] orientation. Statistical variation within the clusters in indentation property space were found to result from crystallographic orientation. The variation in plastic anisotropy (hardness) was relatively small due to the availability of slip systems in the FCC crystal structure. The variation in elastic anisotropy was found to be consistent with theoretical predictions from elastic constants using the Vlassak-Nix model for reduced indentation modulus calculations. This validates the performance of the system and demonstrates its sensitivity for elastic modulus measurements.
Acknowledgements
The author gratefully acknowledges the contributions of the groups who assisted in these measurements. Dr. Indranil Basu of Prof. Loffler’s Laboratory of Metal Physics at ETH Zurich performed the EBSD characterization. EBSD and nanoindentation correlation was done by Sang-Hyeok Lee in the Department and Chair of Physical Metallurgy and Material Physics at RWTH in the group of Prof. Sandra Korte-Kerzel.
References
- E. Rossi, J.M. Wheeler, M. Sebastiani, Current Opinion in Solid State and Materials Science (2023) 101107.
- J.J. Vlassak, W.D. Nix, J. Mech. Phys. Solids 42(8) (1994) 1223-1245.
- W.C. Oliver, G.M. Pharr, Journal of Materials Research 7(6) (1992) 1564-1583.
- P.S. Phani, W. Oliver, Materials & Design 164 (2019) 107563.
- M. Seehaus, S.-H. Lee, T. Stollenwerk, J.M. Wheeler, S. Korte-Kerzel, Materials & Design 234 (2023) 112296.
- J.M. Wheeler, Journal of Materials Research 36(1) (2021) 94-104.
- W.F. Hosford, The Mechanics of Crystals and Textured Polycrystals, Oxford University Press1993.
- R. Hill, Proceedings of the Physical Society. Section A 65(5) (1952) 349.
- C. Zener, Acta Crystallographica 3(5) (1950) 346-354.
- H.M. Ledbetter, R.P. Reed, Journal of Physical and Chemical Reference Data 2(3) (1973) 531-618.
- R. Hearmon, Reviews of modern physics 18(3) (1946) 409.
- M. Yamamoto, Physical Review 77(4) (1950) 566.

