Jun. 15, 2021
Observing polymerization reactions with Raman microscopy
Polymerization reactions are involved in many industrial processes and also occur in everyday tasks, for example during the hardening of glues and drying of paints and varnishes. In order to optimize their products, manufacturers require analytical methods for monitoring polymerization reactions and evaluating the influence of chemical modifications or additives such as catalysts. Here we use Raman imaging for monitoring the polymerization of an air-drying alkyd resin varnish. Such products are commonly used for protective coating of wood and other materials.
The liquid sample was applied to a microscope slide and the polymerization progress was characterized as a function of depth and time using a WITec alpha300 Raman microscope. To this end, an initial depth scan through the entire coating layer was recorded, followed by one per hour at the same sample position for a total of 25. Due to the system’s automated components, no user interaction was required during the entire investigation time of 24 hours. Each of the presented Raman images covers an area of 25 x 31 µm² and consists of 3900 spectra recorded in about 8 minutes.
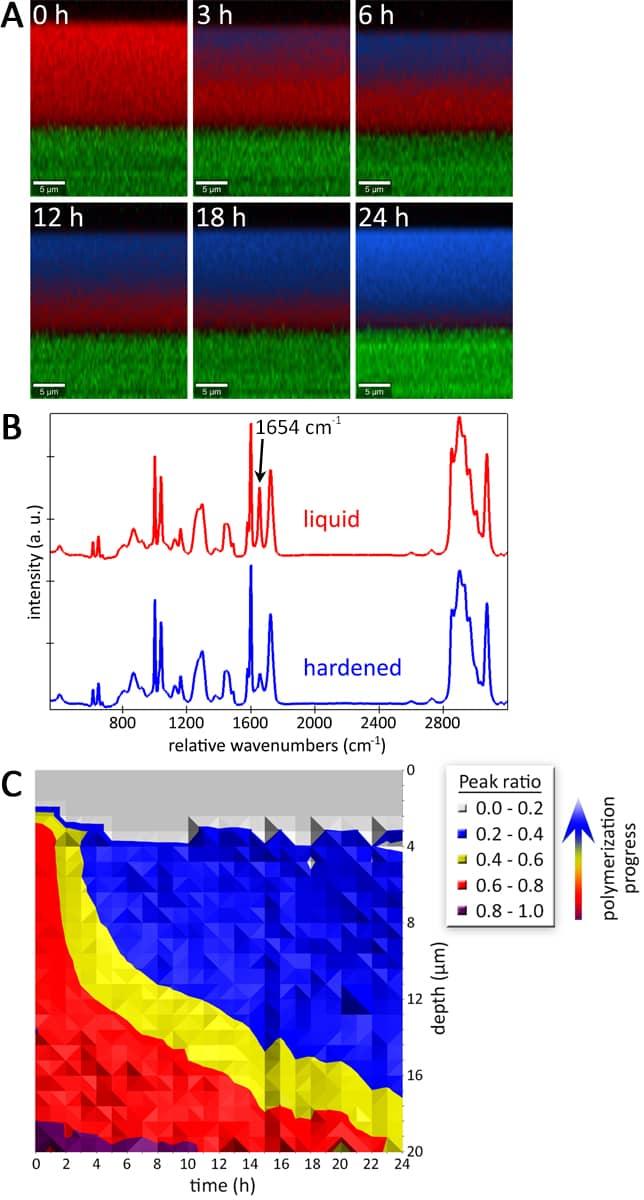
First, all images were analyzed with the TrueComponent Analysis feature of the WITec Project software. Three components were identified by their Raman spectra and attributed to the liquid varnish, the polymerized product and the glass substrate. The image series clearly shows that the hardening process began at the interface between the air and the varnish and progressed through the sample over time (Fig. A and video). After 24 hours, the sample was almost completely hardened. A small stretch of unpolymerized sample was still present at the glass interface after 24 hours, but was no longer detectable when the sample was re-measured a few weeks later.
The spectra of liquid and solid varnish differed mainly in the intensity of the C=C stretching mode at 1654 cm-1 wavenumbers (Fig. B). As the C=C double bonds react during the polymerization, this peak’s intensity is drastically reduced in the Raman spectrum of the product. This enabled an even more detailed monitoring of the polymerization reaction. While the C=C stretching mode was decreased during the reaction, the C-H stretching mode (ca. 3072 cm-1) stayed almost constant. The ratio of these two peaks thus served as a measure for the polymerization progress. It was quantified for each pixel by peak fitting and the mean of each image line was plotted over the sample depth and the observation time (Fig. C). The graph illustrates in detail how the polymerization progresses over time into the deeper layers of the varnish.
For more examples for Raman imaging of polymers, visit our applications section about polymers or download our Application Note about polymeric materials.