Tags: chemical-processes-app, photonic-solutions-for-chemistry-lc, swir-cameras-ps, swir-chemistry
Obtaining Raman spectra especially in reaction monitoring is often plagued by fluorescence either from molecular fluorophores or from particulates, e.g. Pd nanoparticles, in the reaction mixture. An additional challenge is in obtaining true Raman spectra in the presence of chromophores, whose Raman scattering can dominate a spectrum even when present at submillimolar concentrations. Moving into the Near Infrared (NIR) spectral region and away from the resonance absorption regions of the fluorophores is one strategy to circumvent such problems. However the excitation wavelength is essentially limited to 785 nm to 850 nm when depending on traditional silicon based CCD cameras due to the drop off in sensitivity around 1 µm. This is where the relatively new InGaAs based multichannel array detectors can come to our aid, extending sensitivities well into the NIR beyond 2 µm, so that excitation at longer wavelengths such as 1064 nm can be used.
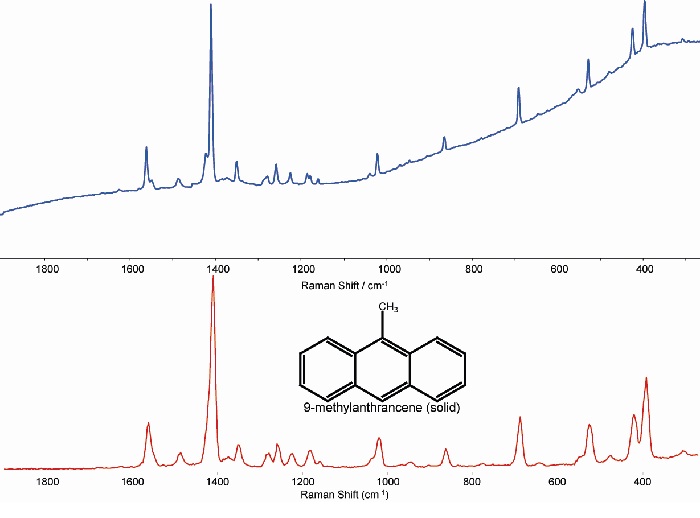
Figure 1: Spectra from 9-methylanthracene, A - ?exc of 785 nm and B - ?exc of 1064 nm.
Obtaining Raman spectra with 1064 nm excitation generally has been limited to Fourier Transform (FT)-Raman systems, which are inherently cumbersome and pose difficulties in applications requiring portability. An added disadvantage is that often the acquisition of a good spectrum results in damaging the sample due to the intensity of the excitation needed, which has serious implications for such research areas as the micro-spectroscopic analysis of living cells. Recently the availability of high quality compact continuous wave 1064 nm lasers together with multichannel NIR sensitive thermoelectric (TE) cooled InGaAs based detectors, such as the Andor iDus InGaAs photodiode array camera, has opened up new opportunities in NIR Raman spectroscopy.
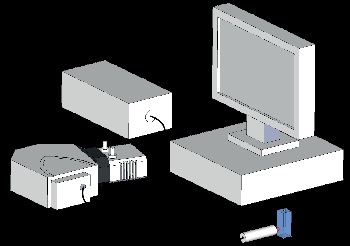
Figure 2: Schematic of experimental setup showing the Raman probe delivering the excitation source to the sample, collecting the Raman signal and delivering it into the spectrograph.
A series of illustrative spectra taken with an Andor InGaAs camera (DU490A-1.7) are given in this note. Figure 1 shows how the influence of fluorescence may be reduced by using excitation at 1064 nm; 1(A) shows the spectrum from a solid sample of 9-methylanthracene at a wavelength excitation of 785 nm, whilst 1(B) shows the spectrum acquired with excitation at 1064 nm (no post processing applied). The reduction in background fluorescence is evident.
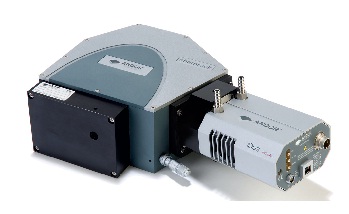
Figure 3: The iDus InGaAs on a Shamrock 163 spectrograph.
The dispersive NIR spectroscopy system used was built around the iDus InGaAs (DU490A-1.7) photodiode array (PDA) coupled via a lens-based flange for increased signal collection (SR1-ASZ-8044) to the Shamrock 163 spectrograph fitted with a 300 l/mm grating blazed at 1250 nm. The spectrograph was fitted with a manual adjustable slit and fibre adapter (SR1-ASZ-8036). Raman scattering was collected via a commercial Raman probe (Inphotonics) configured for excitation at 1064 nm. Excitation via a fibre coupled to a CW 1064 nm laser delivered up to 200 mW power at the sample. The Raman signal was fed into the spectrograph with a ‘circular to line’ short fibre optic. Figure 2 shows a schematic of the system used. A picture of the iDus InGaAs camera and spectrograph is shown in figure 3. The resolution is 12 cm-1 measured using calcite.
Some sample NIR Raman spectra are shown in figure 5. Typical acquisition parameters used were exposures of 5 s with 4 accumulations and the spectrograph was set up with a slit width of 10 µm. The spectra were background corrected and no postprocessing was applied.
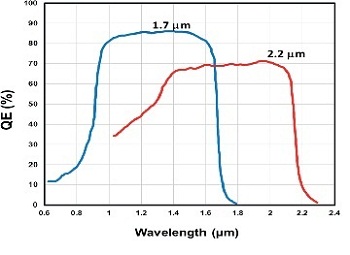
Figure 4: Quantum Efficiency (QE) characteristics of two different InGaAs detectors with extended sensitivities to 1.7 µm and 2.2 µm respectively.
A major problem in NIR Raman is sample heating which produces a substantial amount of background emission, especially with 1064 nm Raman. Even solid samples that do not absorb light at this wavelength can heat up rapidly. Hence it is essential that the detection system is sensitive enough to allow for low laser intensities at the sample. In the examples in figure 5 (ii and iii) sample burning is immediate at 200 mW laser power. Decreasing the power to just 20 mW prevents sample heating but high Signal-to-Noise ratio (S/N) spectra can still be obtained in a short amount of time (< 4 min).
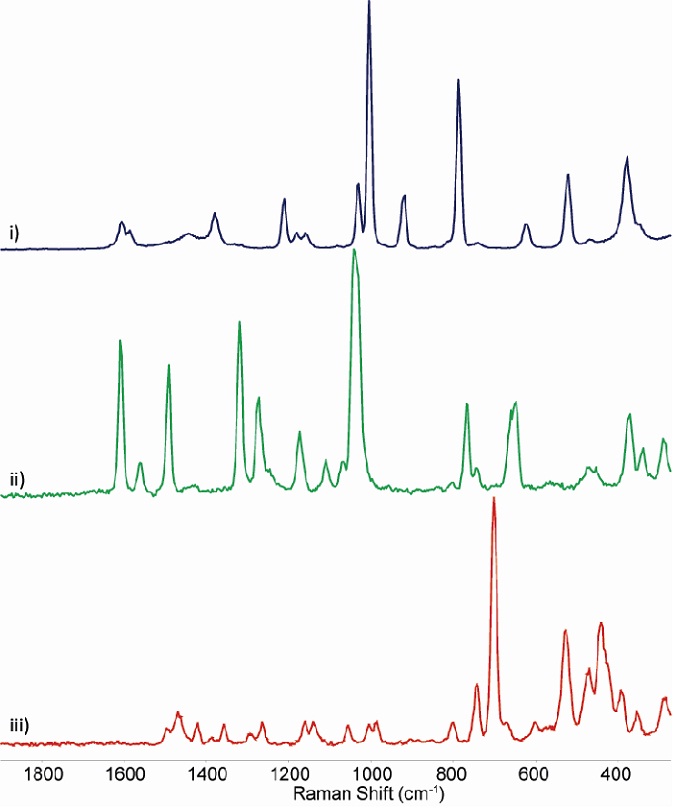
Figure 5: Sample Raman spectra taken in the NIR with a CW Nd-YAG laser at 1064 nm and the iDus InGaAs on a range of different organic and inorganic solid materials. (i) Acetonitrile/toluene (1/1 v/v), 200 mW laser power at sample, sum of five 4 s exposures; ii) [Ru(bipy)3](PF6)2 solid sample, 20 mW at sample, sum of ten 5 s exposures; iii) [Mn2O3(trimethyltriazacyclon onane)2](PF6)2 solid sample, 20 mW at sample, sum of twenty 10 s exposures. Spectra are background corrected. No post acquisition processing has been applied.
InGaAs detectors are available which have different extended sensitivities into the IR. It should be noted though that the levels of dark noise increases significantly for those materials grown to extend sensitivity further into the IR. Thermoelectric (TE) cooling enables cooling of the InGaAs sensor in the iDus down to -90 oC where the intrinsic sensor noise is reduced well below that due to the ambient background. As well as the convenience and reduced running costs, an added advantage of TE cooling compared with the traditional liquid nitrogen (LN2) is the ease of implementation into portable systems.
Acknowledgements
Appreciation is gratefully extended to Dr. Wesley Browne, Centre for Systems Chemistry, Stratingh Institute for Chemistry, University of Groningen, Netherlands and the Netherlands Fund for Technology and Science (STW).
Reference Material
1) For further information – see web links http://www.stw.nl/Projecten/G/goc/11059.htm and http://www.rug.nl/scheikunde/onderzoek/scholen/stratingh/groepen/Browne
2) B. T. Bowie, P. R. Griffiths, Applied Spectroscopy, 57, 190-196 (2003)

