A common misconception that I have encountered is the belief that all wavelength dispersive (WDS, WDX) spectrometers designed for the SEM are the same and will give you the same quality of result.
This is not the case, primarily because there are two different designs, Rowland circle and parallel beam, which have been developed for different reasons and optimized for different purposes.
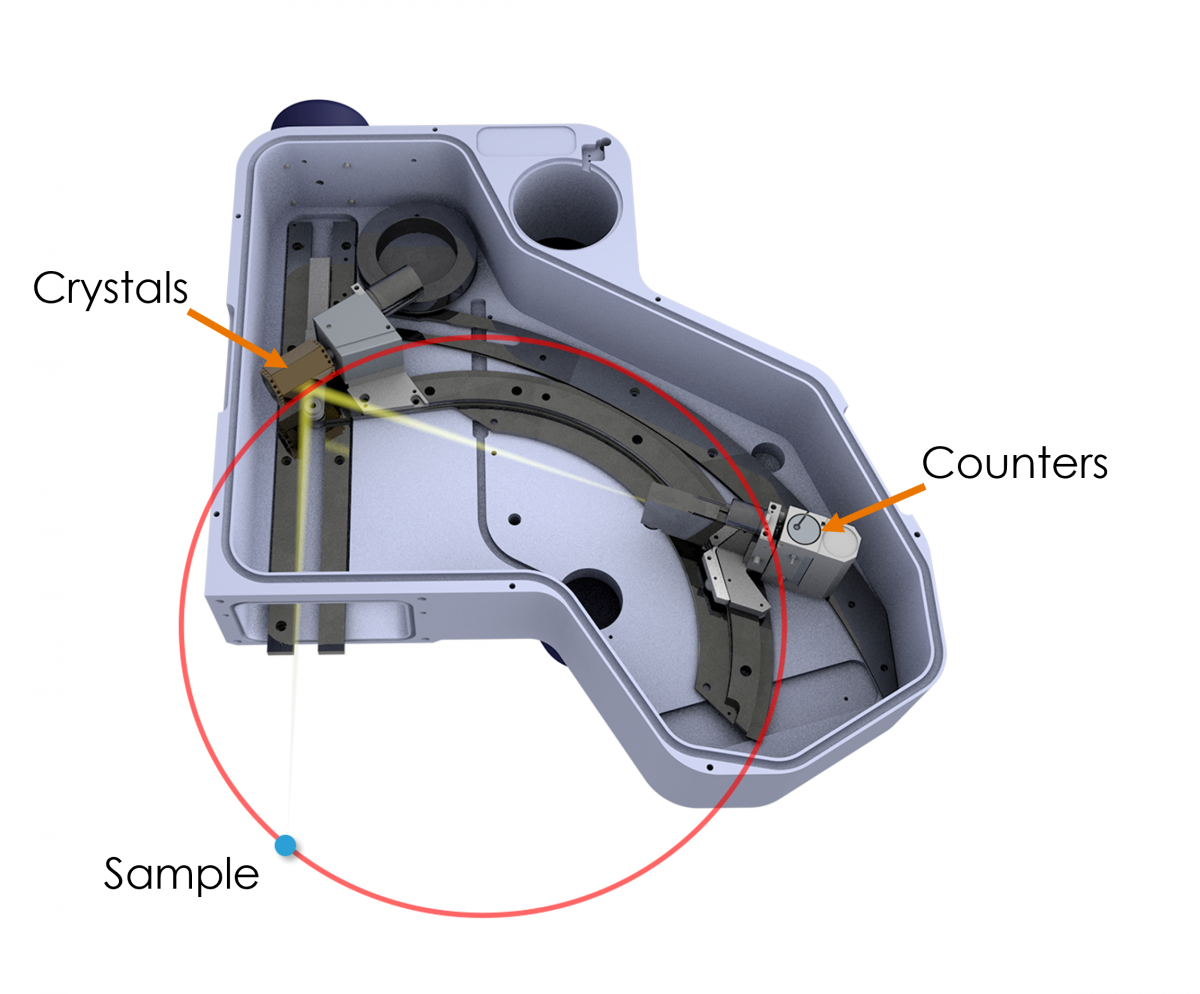
The Oxford Instruments Wave spectrometer is the only WDS solution available for the SEM with a Rowland circle geometry (see Fig. 1). This design is essentially the same as the WD spectrometers that are mounted vertically on an electron microprobe column (i.e. EPMA). Thus, the Wave spectrometer brings a similar level of capability to separate closely occurring X-ray peaks and accurately measure trace elements as can be achieved using an electron microprobe. And, as I will demonstrate here, sometimes the capability of the Wave spectrometer even exceeds that of an electron microprobe.
Figure 1. An internal view of the Wave spectrometer. The Rowland circle is shown in red, and the sample position is indicated by a blue dot. The sample, crystal, and counters lie at a specific, equidistant position on the Rowland circle to measure a particular X-ray wavelength (i.e., element-line). This setup makes Bragg’s law solvable for multiple wavelengths – nλ=2dsinθ (Bragg’s law) forms the basis of WDS analysis, where λ is the X-ray wavelength, n is the diffraction order, d is the spacing between the lattice planes of the monochromator crystal, and θ is the angle of incidence of the X-rays.
Why add a WD Spectrometer to an SEM?
The principal reason for adding a WD spectrometer to an SEM is to attain higher spectral resolution than is possible with the more conventional method for determining elemental composition in the SEM – Energy Dispersive Spectrometry (EDS, EDX, EDXS). This is because higher spectral resolution brings two major advantages; (1) it is possible to separate closely occurring X-ray peaks that overlap in the EDS spectrum and, therefore, accurately quantify them; and (2) it results in higher peak to background ratios, and, therefore, lower detection limits and the ability to measure trace elements.
What partly determines the spectral resolution of a Rowland circle style spectrometer is the diameter of the Rowland circle. The larger the Rowland circle, the greater the spectral resolution. There are physical limitations on how large the Rowland circle can be – the spectrometer must be accommodated and supported on the side of an SEM column. In addition, as the spacing between the sample, crystal, and counter increases (i.e. with a larger Rowland circle), the count rate decreases. Hence, there is a trade-off between resolution and physical spectrometer size/desirable count rate.
The Wave spectrometer has a Rowland circle with a radius of 210 mm, which is larger than is usual for a WD spectrometer mounted on an electron microprobe – these typically range between 100 and 180 mm. As such it is possible for a higher spectral resolution to be achieved with the Wave spectrometer than with a standard electron microprobe.
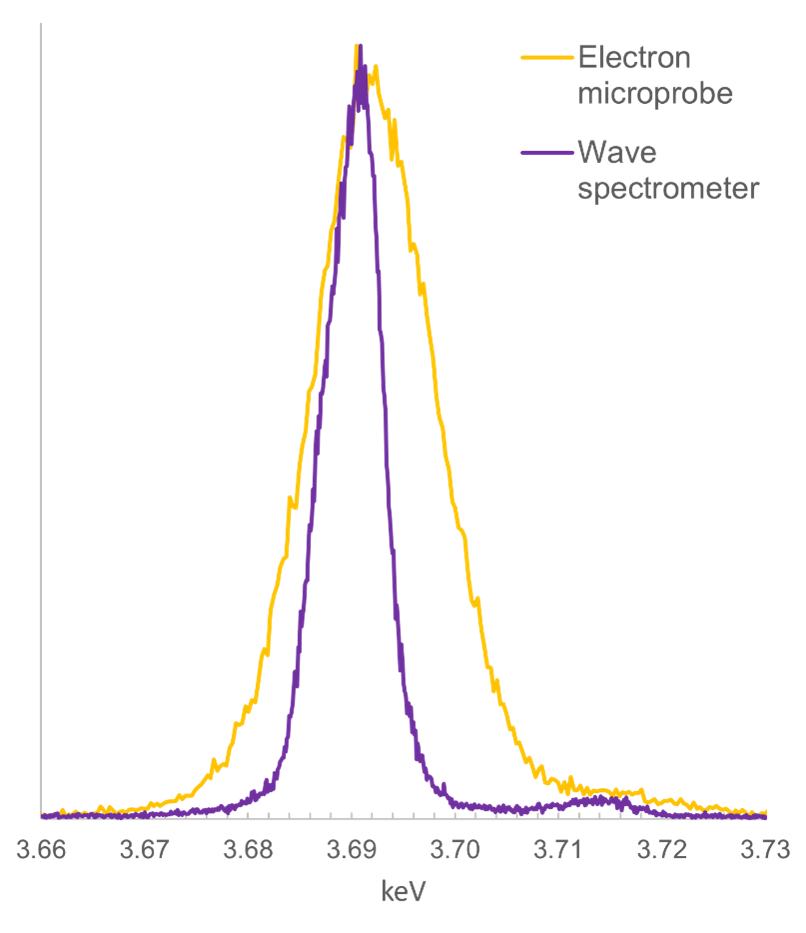
Figure 2 presents a comparison of the Ca Kα peak obtained with the Wave spectrometer, with the same peak obtained using an electron microprobe. As you can see the peak obtained with the Wave spectrometer is much narrower than that obtained with the electron microprobe (FWHM of 7 and 14 eV respectively) – a demonstration of the higher spectral resolution of the Wave spectrometer.
Figure 2. A comparison of WDS scans obtained using the Oxford Instruments Wave spectrometer mounted on an SEM, and an electron microprobe WD spectrometer. The scan is of a Ca Kα peak generated from a wollastonite standard, using similar analytical conditions (e.g., accelerating voltage = 15 kV) and the same diffracting crystal type (PET). The FWHM for the peak obtained using the Wave spectrometer is 7 eV, compared to 14 eV for the electron microprobe.
Parallel beam spectrometers
The other style of WD spectrometer available for the SEM do not use the Rowland circle geometry, but rather they use X-ray optics to transform the divergent X-rays generated from the sample into a parallel beam. One of the motivations for developing this style of spectrometer was to make a compact WDS solution that can be more easily accommodated on an SEM column.
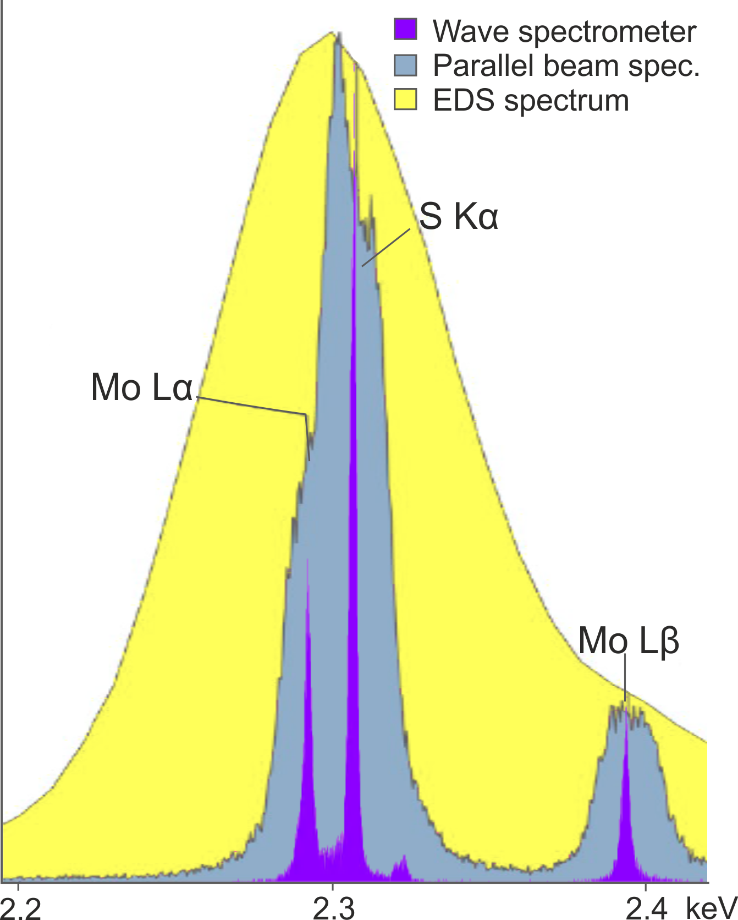
However, using focusing optics rather than a large Rowland circle geometry sacrifices spectral resolution – which as I outlined above, is the primary reason for adding WDS to an SEM. An example of the spectral resolution that can be achieved with the Wave spectrometer versus a parallel beam spectrometer is shown in Figure 3. The Mo Lα and S Kα peaks are separated by just 14 eV and as shown, are fully resolved by the Wave spectrometer, but not by the parallel beam spectrometer – demonstrating the superior spectral resolution that can be achieved using a Rowland circle geometry.
Figure 3. A comparison of the separation of the Mo Lα peak and the S Kα peak achieved using the Oxford Instruments Wave spectrometer, a parallel beam spectrometer, and an EDS detector.
Why is resolution so important?
- If you are trying to quantify an element based on a line that is affected by a peak overlap, then the quantitative result will be inaccurate due to the addition of counts from the other element. There are some workarounds for this (e.g. using a different line, making a correction), but often they are sub-optimal and result in a higher error on the measurement.
- It is difficult to positively identify the presence of an element if it is affected by a peak overlap. This is particularly problematic if you have a trace element peak that is overlapped by a major element peak.
- Higher resolution increases the peak to background ratio, and therefore lowers detection limits (e.g. detection limits for the Wave spectrometer are 9 ppm for Si Kα and 15 ppm for Fe Kα).
- Rolled into this is analysis time – with higher resolution and hence peak-background ratios, the counting time to deliver the same level of error on an analysis is reduced – meaning it is possible to work faster to obtain the same data quality.
This post has outlined the key differences between WD Spectrometer's. You should now understand the primary advantages of choosing a spectrometer that utilises a Rowland circle geometry, and the importance of resolution in element quantification. To learn more about our WDS solutions, click here.