Introduction
Gin is a popular beverage; its characteristic taste comes from using juniper berries to flavour a clear alcoholic spirit distilled from grain or malt. According to EU regulations, for an alcoholic beverage to be considered a gin it must have at least 37.5% alcohol content by volume (ABV). Where ABV is defined as the number of mℓ of ethanol present in 100 mℓ of solution. However, this broad definition does not fully encompass everything that may be considered a gin, partly due to the spread of flavoured gins. These sweetened beverages may have an ABV as low as 20%. Several categories of gin are known, based on factors such as origin, sugar content and method of production. Proper identification and distinction of gins is further made difficult due to limited available information on their chemical composition.
Techniques previously used for analysis of spirit drinks include liquid chromatography, Fourier transform infrared (FTIR), Raman, and ultraviolet-visible (UV-vis) spectroscopies. Several of these techniques suffer from an inability to detect different classes of compounds in a single experiment, or do not possess the necessary sensitivity to detect chemicals potentially present in gin. Utilisation of nuclear magnetic resonance (NMR) spectroscopy is a promising method for the detection of a variety of compounds in a single experiment, as well as their quantification, and the determination of the ABV. Another advantage of NMR is simple and quick sample preparation; indeed, instruments with an external lock allow for a wide range of measurements to be performed on a neat sample.
In this Application Note, we determined the ABV for a range of gins, comparing the measured value with that provided on the label. Unless stated otherwise, all measurements discussed in this application note were performed at Heriot-Watt University on an Oxford Instruments X-Pulse Broadband Benchtop NMR Spectrometer, operating with an internal deuterium lock.
ABV Measurements
A representative 1H NMR spectrum obtained on the X-Pulse of an alcoholic beverage is shown in Figure 1; three signals can clearly be observed, corresponding to:
- a triplet for the CH3 group of the ethanol;
- a quartet for the CH2 group of the ethanol;
- a broad singlet for both the OH of the ethanol, and for water.
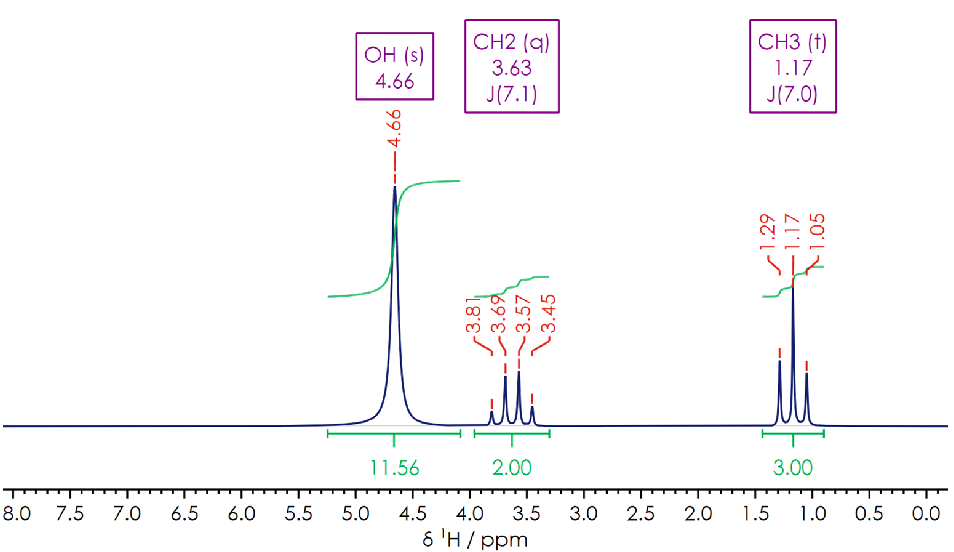
Fig. 1 — 1H NMR spectrum of an alcoholic beverage with an ABV of 38%Two methodologies were employed to determine the ABV parameter of the alcoholic beverages. The first uses direct measurement of the ratio of integrals of ethanol CH3 and OH signals. The second method uses an internal standard to directly quantify the amount of ethanol present in the sample.
To accurately measure ABV, all NMR measurements were performed with parameters ensuring quantitative spectra were obtained, i.e. the relaxation/recycle delay between each scan was at least five-times the longest T1 relaxation time.
ABV by Direct Measurement
Direct measurement of ABV involves measuring the ratio of integrals of ethanol CH3 and OH signals. The OH signal is formed from a combination of the OH from water and the OH from the ethanol. Therefore, to obtain an accurate ratio of ethanol to water, the OH signal integration was reduced by one third of the ethanol CH3 signal integral value.
After processing the spectrum and extracting the necessary quantities, the following equations were used to determine the ethanol content in the sample:
x
E = (ICH3 / 3) / (ICH3 / 3 + IOH / 2)
Where ICH3 is the integral of ethanol CH3 signal, IOH is the integral of water OH signal and xE is the molar fraction of ethanol.
w
E = (xE × 46.07 g·mol−1) / (xE × 46.07 g·mol−1 + (1 − xE) × 18.02 g·mol−1)
Where wE is the mass fraction of ethanol, 46.07 g·mol−1 and 18.02 g·mol−1 are the molar masses of ethanol and water respectively.
ABV
= (wE × ρ) / rE
Where ρ is the density of the ethanol/water mixture with ethanol mass fraction wE in g·cm−3, and rE is the density of ethanol in g·cm−3, both adjusted for temperature of the sample.
The calculated ABV values for eight purchased gin samples, Gin01–Gin08, were compared to the provided label values (see Table 1), showing very good agreement for most samples. However, large discrepancies were observed for Gin06 and Gin07. As these samples contained large quantities of sugar, these discrepancies could be explained by overlap of carbohydrate signals with the OH signal or a change to the water signal intensity due to interactions with many OH groups of the sugars (hydrogen bonding or hydrogen exchange between water and carbohydrates). While the former effect would be expected to increase the intensity of the OH signal (thus reducing the measured ABV), the latter effect is more complex and may lead to the observed lowering of OH signal intensity.
Another possible explanation is that the value provided on the label is inaccurate, due to the method used for ABV determination (traditionally hydrometry) being influenced by the presence of high sugar concentration.
ABV Using an Internal Standard
The second methodology for determination of ABV requires addition of a known amount of an internal standard, in this case maleic acid, and quantifying the ethanol content with respect to the known amount of the standard (see Figure 2 for an example 1H NMR spectrum).
After performing the experiment and processing the spectrum, integrals of the ethanol CH3 and maleic acid CH signals are measured and the ratio between them used to calculate the ABV parameter using the following equations:
CE = (Cma × ICH3) / Ima × 2/3
Where CE is the molar concentration of ethanol in mol·cm−3, Cma is the molar concentration of maleic acid in mol·cm−3, ICH3 is the integral of the ethanol CH3 signal and Ima is the integral of the maleic acid 2×CH signal.
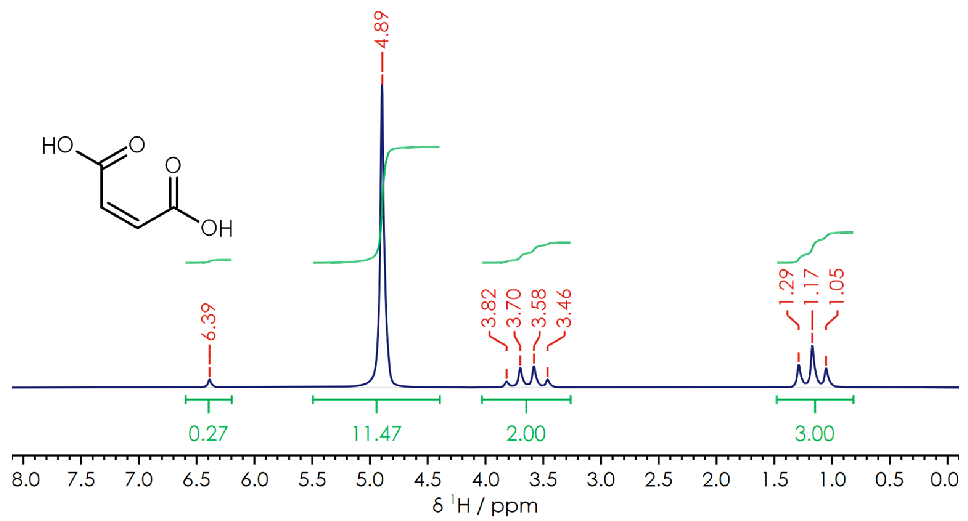
Fig. 2 — 1H NMR spectrum of a gin sample, containing maleic acid as an internal standardABV
= (CE × Vs × 46.07 g·mol−1) / (Vg × rE × 1000) × 100%
Where Vs is the sample volume in cm3, Vg is the volume of gin in cm3 and rE is the density of ethanol (0.789 g·cm−3).
Results of these measurements are also summarised in Table 1. Once again, the obtained ABV values were compared to those on the labels. While the results were generally satisfactory (relative errors in the range of 0.5 to 2.8% for sugarless gins), the reproducibility of results was significantly worse than for the direct measurement of ABV. The standard deviation from the average reached values as high as 1.9% ABV, while the highest deviation for measurements without the standard was 0.4% ABV.
This observation is not unexpected, as the method relies on addition of an accurately measured amount of maleic acid, and is prone to errors during weighing and volume measurements. As a result, more samples need to be analysed to obtain a reliable result, prolonging the analysis.
It is worth noting that once again Gin06 and Gin07 showed the largest deviations in ABV from the label values, but the divergence is much smaller than for the direct measurement. This suggests that the interactions between sugars and water are, at least partially, responsible for the observed values. As the internal standard method does not rely on the OH signal integral it is not affected by said interactions, resulting in a smaller discrepancy. Overall, this method appears less attractive for widespread use, as it requires more substantial sample preparation and additional measurement repetition to ensure reliability.
| Sample | ABV on Label | Direct Measurement — Average ABV | Direct Measurement — Rel. diff. | with Maleic Acid Internal Standard — Average ABV | with Maleic Acid Internal Standard — Rel. diff. |
| Gin01 | 43 | 42.2 ± 0.2 | 1.9% | 41.8 ± 0.7 | 2.8% |
| Gin02 | 43 | 42.7 ± 0.2 | 0.6% | 42.3 ± 0.1 | 1.5% |
| Gin03 | 46 | 46.0 ± 0.1 | 0.9% | 46.2 ± 0.8 | 0.5% |
| Gin04 | 43 | 43.1 ± 0.1 | 0.2% | 43.6 ± 0.6 | 1.4% |
| Gin05 | 46 | 45.9 ± 0.1 | 0.2% | 45.8 ± 0.7 | 0.5% |
| Gin06 | 20 | 21.6 ± 0.1 | 7.9% | 20.7 ± 1.5 | 3.5% |
| Gin07 | 29 | 31.6 ± 0.1 | 9.0% | 28.6 ± 0.7 | 2.8% |
| Gin08 | 37.5 | 37.1 ± 0.2 | 1.0% | 38.2 ± 1.9 | 1.9% |
Table 1 — ABV measurements of selected gin samples with and without an internal standard.ABV Measurement of ‘Unknown’ Gins
Eight unknown gin samples, Gin10–Gin17, were also studied, with comparison to the ABV value on the label only made after the analysis was fully complete. Results of the measurements can be seen in Table 2. Overall, the accuracy was lower than for the previous set of samples, but still satisfactory. Most samples showed deviations from label of less than 2.4% with either analysis method. Gin17 showed the largest divergence of 4.0% relative difference when measured using an internal standard.
Once again, significant variation between values obtained for different samples was observed when using the internal standard, requiring additional measurements to obtain reliable results.
| Sample | ABV on Label | Direct Measurement — ABV | Direct Measurement — Rel. diff. | with Maleic Acid Internal Standard — Average ABV | with Maleic Acid Internal Standard — Rel. diff. |
| Gin10 | 43.1 | 42.6 | 1.1% | 42.3 ± 1.5 | 1.9% |
| Gin11 | 40 | 39.1 | 2.1% | 39.5 ± 0.7 | 1.1% |
| Gin12 | 37.5 | 36.9 | 1.6% | 37.0 ± 0.7 | 1.3% |
| Gin13 | 40 | 40.6 | 1.5% | 40.5 ± 1.3 | 1.2% |
| Gin14 | 41 | 41.2 | 0.6% | 41.4 ± 0.7 | 0.9% |
| Gin15 | 40 | 39.7 | 0.8% | 41.0 ± 0.3 | 2.4% |
| Gin16 | 37.5 | 37.1 | 1.0% | 38.2 ± 0.2 | 2.0% |
| Gin17 | 41.4 | 41.9 | 1.2% | 43.1 ± 1.0 | 4.0% |
Table 2 — ABV measurements of selected ‘unknown’ gin samples with and without an internal standard.ABV Measurements of Beverages with Low Alcohol Content
Following the results obtained from analysis of gin liqueur and sloe gin, which revealed discrepancies between ABV values calculated using NMR and those provided on the label, several samples of ‘alcohol-free’ and low alcohol content beverages were tested to establish whether a similar trend would be observed. At the time of writing, under UK law anything containing 0.05% ABV or less can legally be called alcohol free, while in the EU this limit rises to 0.5% ABV.
These analytes included samples of ‘alcohol-free’ botanical drink (AFB) and wine (AFW), two beer samples: low-alcohol (ALB) and “average” alcohol content (AMB). Two samples of soft drinks with (IBS) and without sugar (IBF) were also investigated. Previous research showed that beverages of this type may contain trace amounts of ethanol, most likely used as a carrier for flavouring compounds. The summary of the results can be seen in Table 3. Once again, analysis was done with and without the maleic acid internal standard.
For AFB, a large discrepancy from the maximum ABV value provided on the label was noted (0.2 ABV measured using NMR, compared to 0.05 ABV on the label). In this case, the divergence cannot be explained by the presence of a significant amount of sugars, as no carbohydrate NMR signals were observed.
Analysis of AFW was inconclusive as the characteristic triplet of ethanol CH3 was not present. Instead, two doublets were present in the same chemical shift region. The most likely explanation for this observation is that the amount of ethanol in the sample was low enough to not be detected and instead other similar compounds were present.
The ABV values measured using both methods for AMB were similar to those provided on the label; however, for the low-alcohol beer, ALB, the calculated ABV was lower than the label value. These results suggest that while the methods utilised by the producer for ABV measurement are accurate for ‘normal’ ethanol content around 5%, they might not have the necessary accuracy when drinks with lower ABV are concerned.
The analysis of soft drinks revealed the presence of small amounts of ethanol (around 0.01% ABV) in the sample containing sugar. This result is not, however, entirely conclusive, as the detected signal was not a clear triplet. It is therefore possible that the detected signal could have been misassigned. In contrast, the sugar-free sample did not show any trace of ethanol.
| Sample | ABV on Label | Average ABV by Direct Measurement | Average ABV Measurement with Maleic Acid Internal Standard |
| AFB | <0.05 | 0.2 ± 0 | 0.2 ± 0 |
| AFW | <0.05 | — | — |
| GALB | 0.5 | 0.4 ± 0 | 0.3 ± 0 |
| AMB | 4.5 | 4.6 ± 0.1 | 4.6 ± 0.2 |
| IBS | none | 0.011 ± 0.002 | 0.008 ± 0.001 |
| IBF | none | — | — |
Table 3 — ABV measurements of selected ‘low-alcohol’ samples with and without an internal standard.Summary
These results show that benchtop NMR spectroscopy is effective for the determination of ABV in most alcoholic beverages. Other methods, such as high-field NMR spectroscopy, may provide additional insights such as the detection or quantification of compounds at low concentrations within a reasonable time.
This approach is not only applicable to the measurement of ABV, but the quantification of components in other mixtures. For example, the mixtures of alkyl carbonates used as solvents in the electrolytes of lithium-ion batteries.
The Oxford Instruments X-Pulse Broadband Benchtop NMR Spectrometer is now available with an external deuterium lock as standard, which allows for the measurement of neat liquids such as alcoholic beverages with no sample preparation. An optional 25-position autosampler can be used to maximise efficiency and throughput.

