Droplet size distribution (DSD) is an important characteristic of emulsions. Its determination is crucial for quality
control and assessment of products at various stages of processing, manufacturing, and production, and for evaluating
properties of new formulations in research and development. In many industries, there is a requirement to determine
the DSD of different emulsions simply, accurately and without disrupting the sample structure.
An emulsion is as a mixture of two or more immiscible liquids that form a system of dispersed droplets (dispersed
phase) separated by the continuous phase matrix. Examples include margarines, butters, food dressings, paints and
crude oil. Emulsions typically remain stable and keep their structure (i.e. the droplets do not coalesce) for a
significant period of time and under certain conditions (e.g. temperature).
This application note demonstrates how MQC-R, a research focused time domain, nuclear magnetic
resonance (NMR) spectrometer can be utilized to routinely determine the DSD in emulsions, in this case in a sample of
margarine, and therefore may be employed in a quality control environment.
The time domain NMR approach
The time domain NMR method for analysing DSD is based on the phenomenon of restricted diffusion. The effective
mobility of the dispersed phase molecules moving within the droplets is significantly lower, compared with that of the
equivalent bulk liquid, due to interactions with the droplet walls. As such, information about droplet size can be
obtained through NMR diffusometry measurements.
Raw data are acquired in the form of NMR signal diffusion decays. For an emulsion sample, where continuous and
dispersed phases are present, both these components produce an NMR signal.
In order to collect NMR data only for the dispersed phase, the signal from the continuous phase is removed by
applying a suitable T1 relaxation filter, followed by a pulsed-field gradient (PFG) diffusometry protocol.
To further enhance the signal selection, the sample temperature is held constant using a variable temperature (VT) NMR
sample probe. Under such conditions, the effective T1 relaxation time of the continuous phase is much
shorter than that for the dispersed phase, and therefore the efficiency of the T1 filter is improved
further.
Advantages of using MQC-R for droplet size distribution analysis:
- Easy and reliable technique
- Simple sample preparation
- Non-destructive: measure the same sample multiple times
- Delivers droplet dimension data, rather than droplet clusters
- No hazardous solvents or waste involved
- Direct measurement of a bulk sample
- Applicable to a wide range of emulsions
- Consistent results by fixing the sample temperature
Sample preparation
For each different emulsion formulation, three samples need to be prepared:
- A pure sample of the continuous phase
- A pure sample of the dispersed phase
- An emulsion sample, or set of emulsion samples made up of the continuous and dispersed phases
In addition, a sample of deionised water may be required for the calibration.
In this example application using margarine, we prepared the following three samples: (1) dispersed phase inside the
droplets (water-based), (2) continuous phase (fat-based), and (3) emulsion - margarine. Once prepared, the samples
were transferred into NMR tubes, and conditioned at +5°C, which is the typical temperature used when measuring the DSD
of dairy products.
Calibration procedure
Calibration consists of three automated steps:
- Adjusting the parameters of the T1 filter to remove the continuous phase NMR signal
- Collecting diffusion data for pure (deionised) water to adjust the effective strength of the PFG
- Collecting diffusion data for the pure dispersed phase to define the initial parameters for data processing
Analysis procedure
Provided the instrument has been calibrated for samples containing the same continuous and dispersed phases, it may
be used to routinely collect diffusion data, without further refinement, from emulsion samples equilibrated at the
same temperature used for the calibration – this data is then used to determine the DSD results.
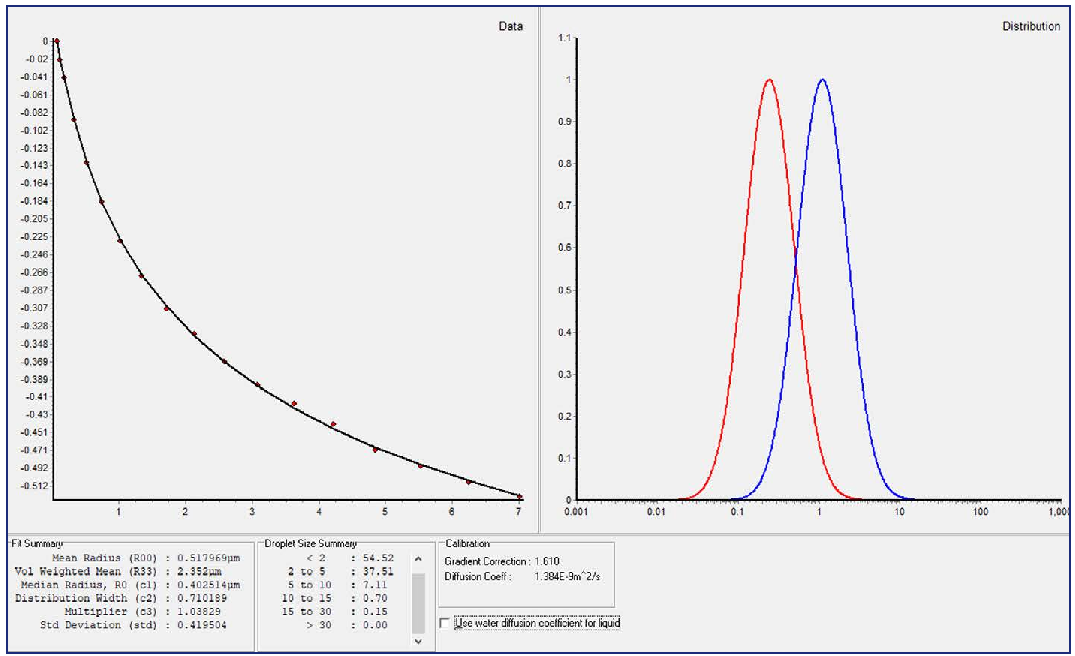
Fig. 1 — The DSD results obtained using the MQC-R after the fitting of NMR diffusometry data for a margarine
sample. The experimental diffusion decay (red solid circles) and the log-normal fitting curve (solid black line) are
shown in the left-hand graph window. The volume-weighed droplet size distribution (blue curve) and the mean size
distribution (red curve) are plotted in the right-hand graph. The numerical parameters of the distribution are
listed in the "Fit Summary" and "Droplet Size Summary" tables below.
Results
The data is processed using a log-normal distribution of diffusion coefficients. The fitting results are reported as
a graph of the distribution function and as a set of the distribution function parameters (Figure 1): the mean radius
of droplets (R00), the volume-mean radius (R33), the median radius (R0), the
distribution width (σ), and the percentage of droplets falling within a user-specified, predefined radius range.
Tables 1 and 2 show the repeatability of the DSD measurements made with the MQC-R.
| Droplet size distribution parameters |
Repeat 1 |
Repeat 2 |
Repeat 3 |
Average value for three repeats (μm) |
Standard deviation for three repeat measurements (μm) |
| Mean radius, (μm) |
0.61 |
0.54 |
0.52 |
0.56 |
0.04 |
| Volume weighed mean, (μm) |
2.31 |
2.38 |
2.35 |
2.35 |
0.03 |
| Median radius, (μm) |
0.49 |
0.43 |
0.40 |
0.44 |
0.04 |
| Distribution width, (μm) |
0.67 |
0.70 |
0.71 |
0.69 |
0.02 |
Table 1. Repeatability of DSD measurements obtained for the margarine sample using the MQC-R.
| Droplet radius ranges* |
Repeat 1 — Percentage of droplets with radius within the respective range (%) |
Repeat 2 — Percentage of droplets with radius within the respective range (%) |
Repeat 3 — Percentage of droplets with radius within the respective range (%) |
Average value for three repeats (μm) |
Standard deviation for three repeat measurements (μm) |
| Smaller than 2 μm |
54.06 |
53.47 |
54.52 |
54.02 |
0.43 |
| From 2 to 5 μm |
39.04 |
38.40 |
37.51 |
38.32 |
0.63 |
| From 5 to 10 μm |
6.33 |
7.28 |
7.11 |
6.91 |
0.41 |
| From 10 to 15 μm |
0.49 |
0.70 |
0.70 |
0.63 |
0.10 |
| From 15 to 30 μm |
0.09 |
0.15 |
0.15 |
0.13 |
0.03 |
| Larger than 30 μm |
0.00 |
0.00 |
0.00 |
0.00 |
0.00 |
* The number of the radius ranges and their numerical borders can be defined by the user.
Table 2. Repeatability of measurement of the content of droplets with a specific radius using the MQC-R for
margarine.
Conclusion
As demonstrated, MQC-R provides a non-destructive and reliable method for determining DSD in
emulsions and enables the properties and consistency of products to be easily monitored. Sample preparation is
straightforward, with no need for hazardous solvents or contrast additives. In addition, the sample is maintained at a
constant temperature to preserve the emulsion structure during analysis. Furthermore, the NMR technique is
non-destructive, so the same sample can be analysed multiple times before being used elsewhere.
Ultimately, MQC-R enables more definitive and accurate formulation of new emulsions, as well as
increased consistency in manufacturing and better process control, leading to reduced costs.

