Introduction
One of the main questions in the field of viticulture is "when are wine grapes ready to harvest?". Grapes that are harvested either too soon or too late in the ripening process will produce wine with an undesired flavor profile. Various morphological and physiological changes take place in grapes during the ripening process. Some examples include changes in grape color, size, texture, sugar levels, moisture content, pH and secondary compound levels. Therefore, measuring these properties is crucial to help deduce the ideal harvest window.[1]
Here, we show that time-domain NMR (TD-NMR) is a simple, rapid and non-destructive technique for measuring moisture content and probing water mobility and compartmentalization within grape tissues. TD-NMR is based on monitoring the decay of the proton NMR signal, usually defined by transverse relaxation time, T2, which reflects the sample’s physical properties and composition. For example, samples with longer T2 generally contain more free and mobile molecules, whereas a shorter T2 is associated with more restricted mobility
Banana ripening has previously been studied[2] using TD-NMR. Three unique relaxation signals, also known as “T2 components”, were found in unripe bananas. These three signals originated from water present in the banana’s cell wall (T2 = 15 ms), cytoplasm (T2 = 100 ms) and vacuole (T2 = 300 ms). Upon ripening, the T2 were remeasured and shown to increase for each of the three components. This increase in T2 was attributed to the breakdown of starch, which has a relatively short T2, into simpler sugars which have longer T2’s upon ripening. Therefore, the ripening of bananas could be monitored by observing changes in T2.
1H T2 distribution for monitoring grape ripening
In this study experiments were performed on supermarket grapes, and the T2 distribution data was acquired and processed using NMR ProLab for MQC-R software. The equipment used was Oxford Instruments MQC-R (23MHz equipped with a 26 mm probe). While the ripening process stops after grapes are plucked, further changes in morphology and composition can occur through the evaporation of water from grapes.[3] To speed up these changes, grapes were dried in an oven at 60ºC. The NMR signal of grapes was measured before and after drying in an oven. Example results are shown.
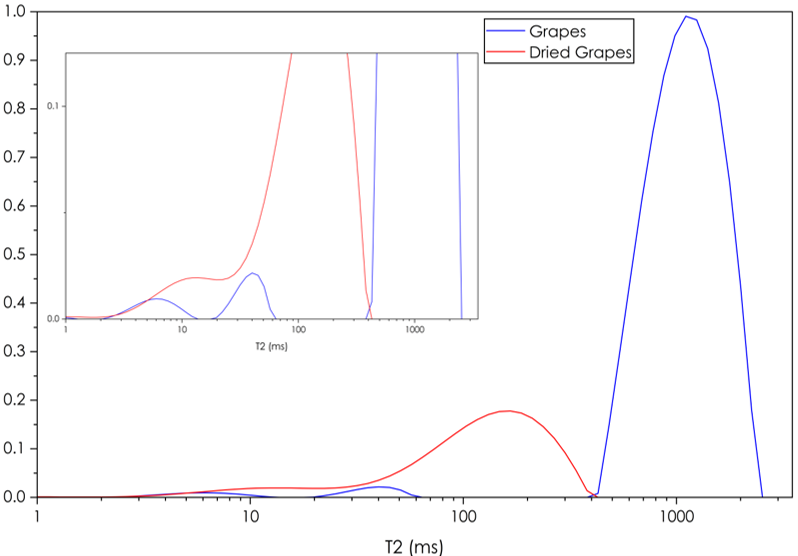
Figure 1: T2 distribution plot of supermarket grapes before (blue) and after (red) drying in an oven at 60ºC for 96 hrs. Inset: Zoomed in version of the plot
On the x axis, we see the T2 distribution of the various components in the grape sample, and the y axis represents the signal intensity from a given T2 component. Various observations stand out with the results. Firstly, three T2 components were present, just as seen in literature data from the banana results mentioned earlier. Secondly, the relative intensities of each component were similar to the banana ripening results, with the shortest T2 component (<10 ms) having the lowest intensity signal, the middle T2 component (50 ms) having a slightly more intense signal than the shortest component, and the most prevalent T2 component being the longest T2 component (~1000 ms). The parallels with the banana results suggests water compartmentalization is similar in grapes and exemplifies the power of TD-NMR in helping understand grape berry microstructure.
The evaporation of water from grapes causes the fruit to shrink in size and develop a shrivelled morphology. This brings us to the third observation, which is the decrease in total peak intensity upon storage (Figure 1), which could be attributed to the loss of water from evaporation. Finally, we also see a dramatic shift in the T2 distribution, with the longest T2 component shifting closer to 200 ms, likely arising from the change in water mobility upon dehydration. We would expect that ripening related changes in grape berries would similarly affect water mobility and thus be refelcted in TD-NMR results.
Moisture content analysis
To further demonstrate the uses of TD-NMR in wine grape berry testing, we analysed grape moisture content using the MQC-R. Moisture content directly influences grape juice yield and extraction behaviour during winemaking. TD-NMR can rapidly quantify water content and provide complementary information on water mobility. This gives a more complete picture of grape condition than conventional moisture measurements alone.
Here, the intial NMR signal, i.e. signal at t=0 s, was plotted against the grape weight before and after drying. The results show that the NMR signal was very well correlated (R2 = 0.99) with the grape weight and thus the moisture content (Figure 2). Each measurement here was made in 3 minutes.
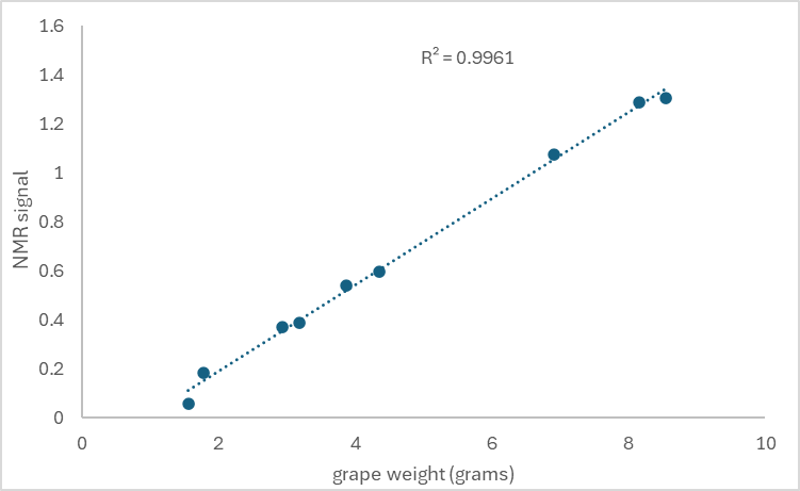
Figure 2: A plot of NMR signal (y axis) vs grape sample weight in grams (x axis)
Conclusion
Overall, these results demonstrate that changes in physical properties such as moisture content and water mobility of supermarket grapes upon dehydration, are clearly reflected in the TD-NMR data. These changes are expected to accompany wine berry ripening processes as well. Generally, these changes are not captured by the standard chemical assays used in the contract wine testing industry. Moreover, the measurements are rapid and non-destructive. Therefore, the Oxford Instruments MQC-R can be a very useful tool for wine makers to improve harvest timing decisions, predict juice yield and extraction behaviour, and provide an additional, objective layer of quality control if integrated alongside established methods.
Sources
[1] https://aggie-horticulture.tamu.edu/vitwine/2019/07/15/grape-berry-ripening-and-sampling-techniques/ [2] Food Chemistry 89 (2005) 149–158
[3] https://shiftychevre.com/do-grapes-continue-to-ripen-after-picked

