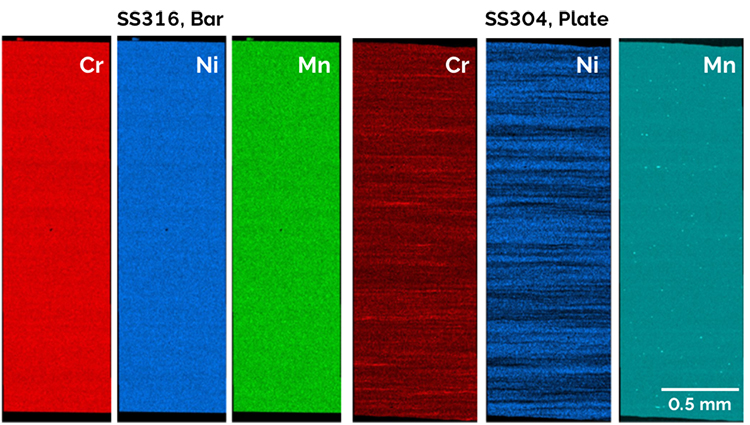
Figure 1 – Large-area BEX montages of stainless steels SS316L and SS304L reveal striking differences in segregation patterns. SS304L, manufactured as a plate, exhibits significantly more pronounced segregation than SS316L, manufactured as a bar—highlighting how processing history directly influences microstructural uniformity.
The results suggest that manufacturing history can produce different segregation behaviour. This rapid visualisation provided an immediate, qualitative insight into compositional differences that could impact steel performance.
Large-Area Quantification of Diffusion within Welded Steel
A welded steel sample was analysed over a 4 cm² area to determine micro-segregation patterns, namely Ni-Cr variations, and the influence of welding heat. Using 20 kV and 3.5 nA, 239 mapped fields were automatically collected in 13 hours. The resulting montage contained 734 million pixels, producing a high-resolution dataset for in-depth analysis. Simultaneously, a fully correlated EDS dataset was acquired using a single Ultim Max ¥ 100.
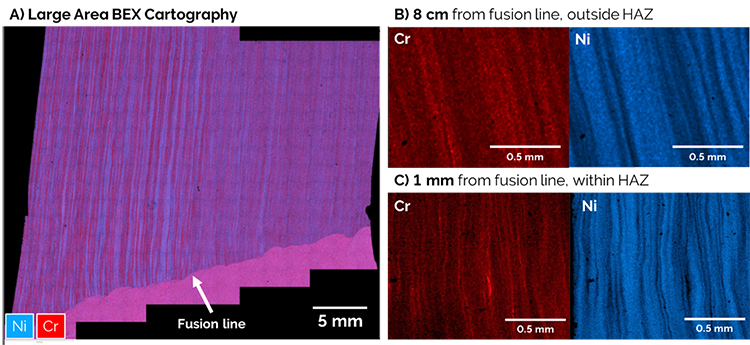
Figure 2 – Large-area (4 cm²) BEX mapping of a welded SS316L sample shows the clear boundary between heavily segregated base steel and homogeneous weld metal. The undulating fusion line marks where segregation ceases, providing immediate visual confirmation of microstructural change across the heat-affected zone (HAZ).
The BEX image revealed a well-defined fusion line separating heavily segregated steel from the more homogeneous weld material. Segregation patterns extended over centimetres in the steel, while high-magnification extracts at 1 mm and 8 cm from the fusion line confirmed that these patterns pre-dated the welding process, occurring both within and outside of the heat affected zone.
Using the reconstruct spectrum tool, three EDS spectra were extracted from the correlated EDS map within the data cube. Guided by the qualitative BEX element map (Fig. 3A), EDS spectrum reconstruction revealed up to 5 wt.% variation in Cr and Ni within the steel (Fig. 3B). This variation became immediately apparent after QuantMap processed the BEX data, generating a fully quantified 2D representation of Ni distribution across the sample (Fig. 3C).
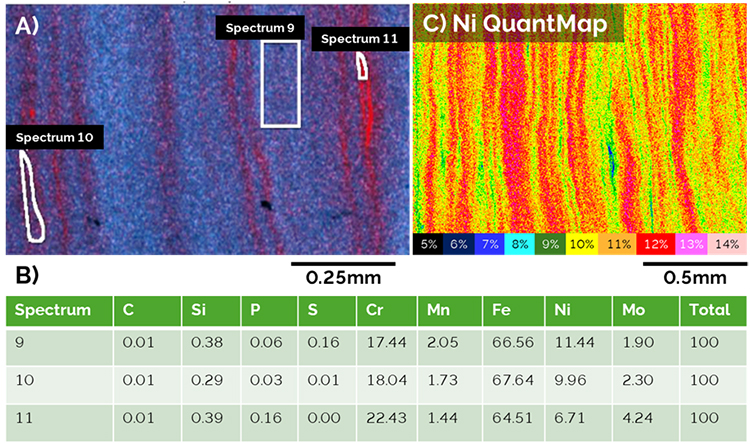
Figure 3 – (A & B) Quantitative EDS extracted from the large-area BEX dataset shows substantial variation in Cr and Ni content within the segregated steel—up to 5 wt.%. (C) QuantMap analysis of a 2 mm² subsection displaying Ni wt.%. The map reveals more than 6 wt.% variation in Ni concentration as a result of segregation.
This variation has practical consequences: localised differences in Ni content could have triggered the formation of residual ferrite and alter the steel’s corrosion/mechanical behaviour, potentially leading to uneven corrosion resistance. Interestingly, in this case, the Cr content remained above the critical 12% level in the regions studied and no loss in passivation is expected.
Conclusions
Micro-segregation analysis demands both speed and accuracy—requirements that can challenge traditional electron microprobe-WDS workflows. The Unity BEX detector offers a practical solution, delivering rapid qualitative detection with the ability to perform fully correlated quantitative maps. Furthermore, our SEM-BEX approach can be performed at greatly reduced cost suitable for less experienced microanalysis.
In this study, combined BEX and EDS enabled:
- Rapid assessment of segregation differences between two stainless steels in minutes.
- High-resolution quantification of Ni-Cr variations (up to 100% relative) across large, welded steel areas.
- Accurate quantification of local Cr content can be linked to corrosion resistance while in service.
By combining fast, high-count BEX mapping with fully correlated EDS analysis, manufacturers and researchers can detect, visualise, and quantify segregation efficiently, helping ensure material performance and reliability from production through to application.
Acknowledgements
We give our sincere thanks to PhD student Anjuli Bali, Prof. Sergio Lozano-Perez of Oxford University and the Materials Ageing Institute (MAI) for their collaboration and contribution to this study.
References
- Smith, R., 2018. Microsegregation measurement: methods and applications. Metallurgical and Materials Transactions B, 49(6), pp.3258-3279.
- Sun, C., Xiao, R., Li, H. and Ruan, Y., 2022. Effects of phase selection and microsegregation on corrosion behaviors of Ti-Al-Mo alloys. Corrosion Science, 200, p.110232.
- Na, H., Lee, S. and Kang, C., 2018. Effect of micro-segregation on impact toughness of 2.25 Cr-1Mo steel after post weld heat treatment. Metals, 8(6), p.373.
- Lynch, P.C. and Grimm, T.J., 2019. Reducing microsegregation in next-generation high-strength low-alloy cast steels. International Journal of Metalcasting, 13(4), pp.783-792.