Application Notes
Understanding changes in porosity as a function of overburden pressure in shales
Published: 03 Nov 2026 · Last updated: 03 Nov 2026
This Application Note was created in collaboration with Green Imaging Technologies

Introduction
For the profitable development of shale reservoirs, it is critical to understand the natural fractures in the rock and how they may or may not interact with hydraulic fracturing. When performing core analysis, it is also important to assess whether the measured properties have been altered by fractures induced during coring.
A key indication of the quantity of the fractures can be obtained by measuring the amount of porosity contained in the fracture network. In shale formations there usually exists at least two distinct pore networks — one associated with the intergranular pore network and one associated with the pores within the organic rich kerogen. The fracture network, either natural or induced, could be thought of as a third pore network which at ambient pressure would be the largest in size. The T2 distribution is still able to distinguish the different pore networks because the organic pores are much smaller than their non-organic counterparts. In addition, the T2 distributions of the three pore networks should change differently as a function of confining pressure allowing further distinction of the three pore networks to be made.
In this application note, we describe techniques using NMR that can not only obtain the total porosity of shale samples but can also quantify the amount of porosity arising from the fractures. NMR measurements of the T2 relaxation time were performed at different confining pressures to quantify the porosity loss as confining stress increases.
Method
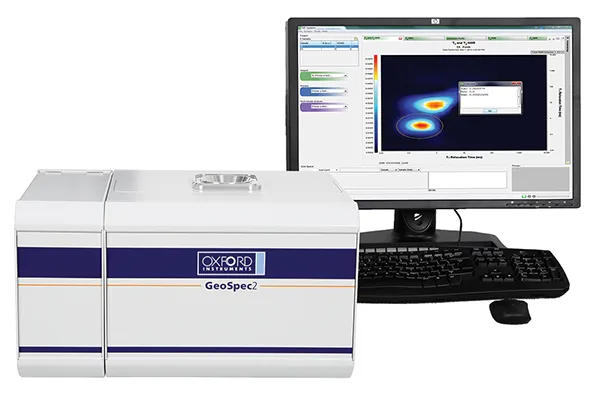
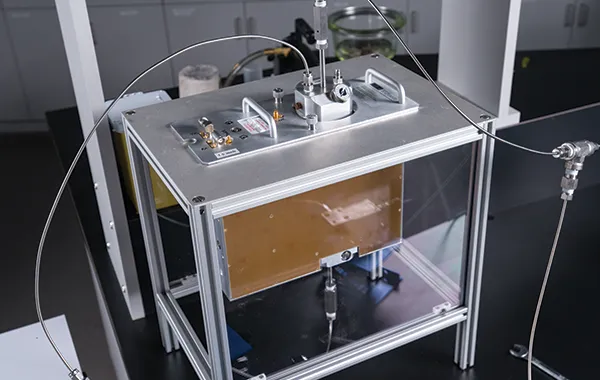
The total porosity and T2 distribution as a function of confining pressure of four shale core samples was investigated using NMR. Each dry shale sample was saturated with brine via pressure saturation at 10,000 psi using a Phoenix Instruments pressure vessel. Following this saturation procedure, each shale sample was confined hydrostatically by fluorinert in an Oxford Instruments P5 overburden NMR probe. Once the pressure was stabilized, the cell was inserted into an Oxford Instruments GeoSpec 2/53 rock core analyzer. The porosity of each shale core sample was then tested as a function of confining pressure at 0, 1000, 2000, 3000, 4000 and 5000 psi. A T2 NMR acquisition scan of each sample, at each pressure, was used to measure the T2 pore distribution as a function of confining pressure. The T2 distribution of a fluid saturated rock is proportional to its pore size distribution. Fluid in smaller pores has a shorter T2 value while fluid in larger pores has a longer T2 value. The pore volume at each confining pressure was determined by summing the area under the T2 distribution curve. The NMR instrument had been calibrated with a sample of known volume so the NMR signal amplitude indicated the volume of fluid within the shale samples. Acquisition and analysis of the T2 data was achieved via Green Imaging Technologies' software.
Results
The pore-size distribution for each shale core sample tested at 5,000 psi of confining pressure can be seen in Figure 1. Shales 1 and 3 have a single sized pore network while shales 2 and 4 have three pore networks (labeled: micro, meso and macro) of varying size. For shale samples 2 and 4, the cumulative porosity of each network was estimated by summing the incremental porosity in certain T2 ranges corresponding to the different pore networks.
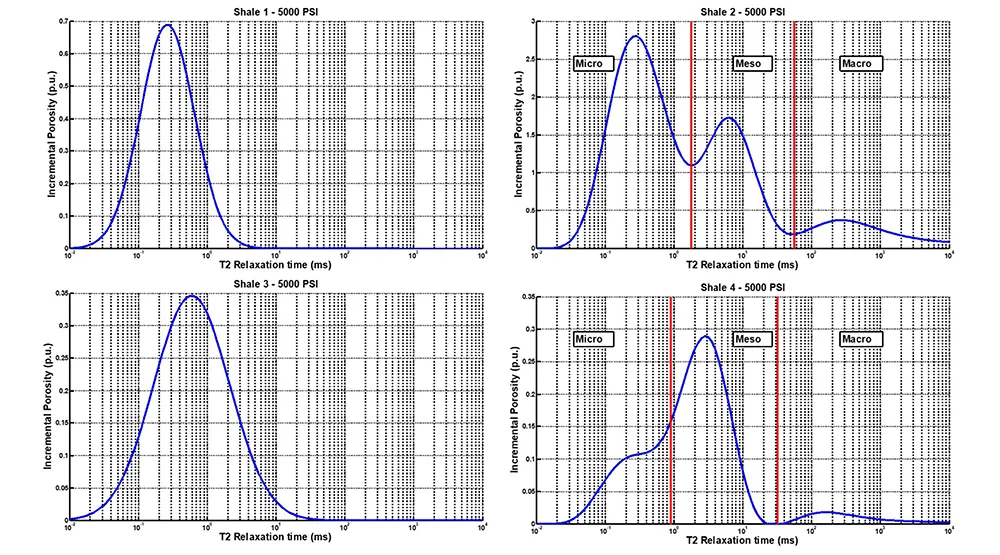
Fig. 1 — Pore distribution for shale samples tested at 5000 psi confining pressure
The left panel of Figure 2 shows the porosity of each pore network of shale 2 plotted as a function of confining pressure. This plot shows that the micro pore network makes up the majority of the total porosity of shale 2 (~2.5 p.u.) while the macro porosity (~0.5 p.u.) accounts for the least portion of the total porosity of shale 2. The center panel of Figure 2 shows the porosity normalized to 0 psi and plotted as a function of pressure.
From this plot it is immediately obvious that each pore network behaves differently with confining pressure. The micro pore network (blue line) shows no compression with confining pressure. The meso pore network (green line) shows an approximately linear compression with confining pressure. The macro pore network shows a sharp decrease in porosity from 0 to 1,000 psi and then no further compression from 1,000 to 5,000 psi. This is consistent with the observations of Chhatre et al. [1]. In their study, there was a significant decrease in permeability with increasing stress, suggesting that the largest pores compacted the most.
Finally, the right panel of Figure 2 shows the cumulative porosity of shale 2 as a function of confining pressure. Again it is obvious that the micro pores contribute to the majority of the total porosity of shale 2 while the macro pores contribute the least.
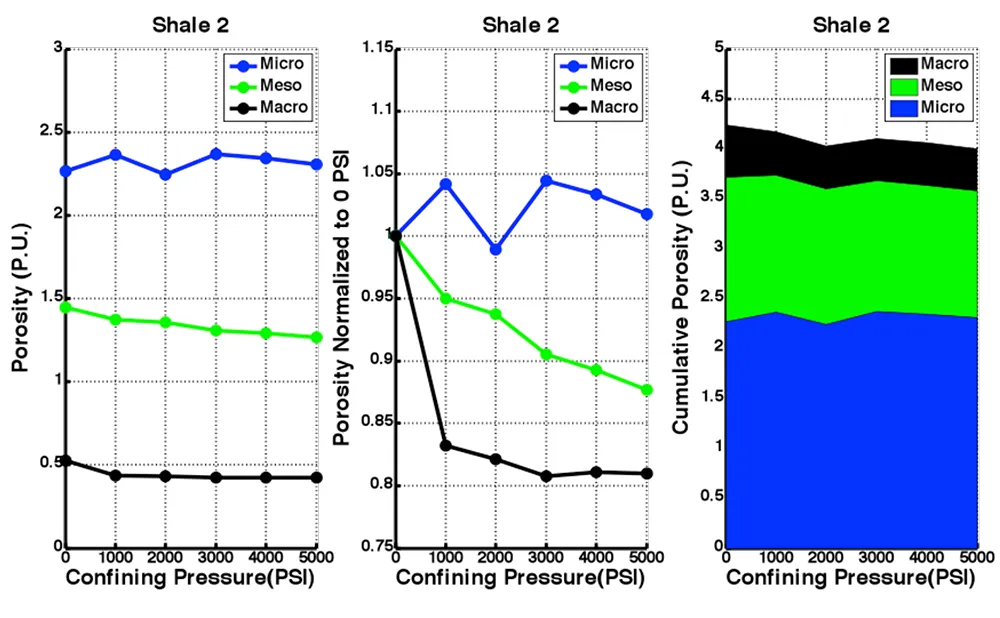
Fig. 2 — The porosity of the pore networks of shale 2 as a function of pressure
Figure 3 shows the porosity data for shale 4 analyzed in the same fashion as the data for shale 2.
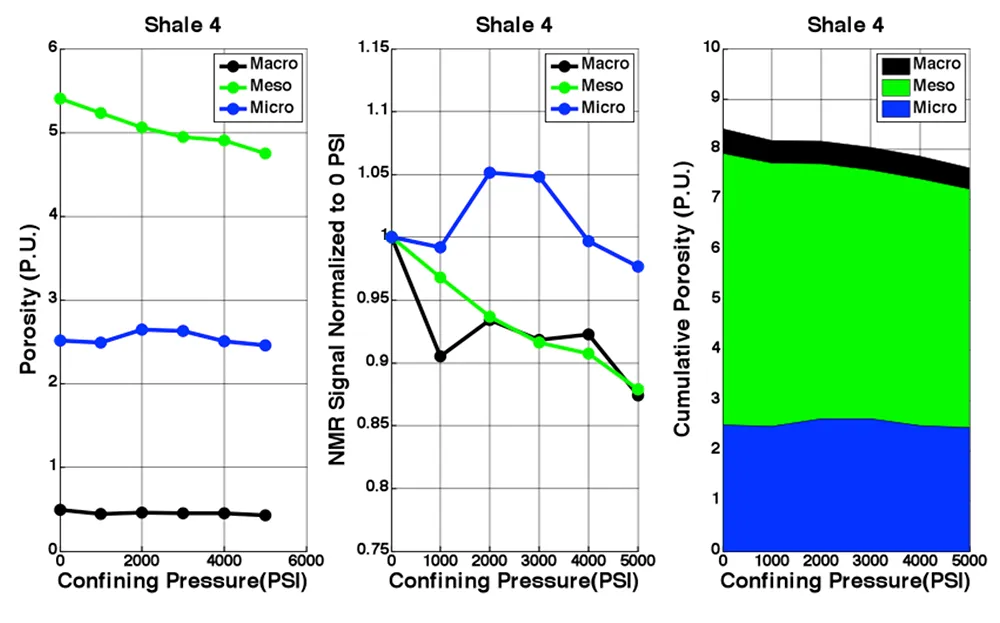
Fig. 3 — The porosity of the pore networks of shale 4 as a function of pressure
Conclusion
A method has been presented for using NMR T2 relaxation times to identify pore networks in shales and their dependence on stress. Four samples were tested, all taken from wells in potential hydrocarbon-bearing formations. Two samples had a complex (trimodal) pore size distribution, and two contained only very small pores.
Where a complex distribution was present, the stress dependence varied by pore size. The largest (macro) pores compressed significantly at relatively low stress (1,000 psi), and very little thereafter. This behavior is likely due to the closure of natural or induced fractures. The smallest (micro) pores show no significant change with stress. This is interpreted to indicate that these pores are not part of the mechanical fabric of the rock. The intermediate size (meso) pores show a continuing compression across the range of stresses.
References
- Chhatre, S.S., Braun, E.M., Sinha, S., Determan, M.D., Passey, M.D., Zirkle, T.E., Wood, A.C., Boros, J.A., Berry, D.W., Leonardi, S.A. and Kudva, R.A., Steady State Stress Dependent Permeability Measurements Of Tight Oil Bearing Rocks, 2014 Annual Symposium Of The Society Of Core Analysts (SCA2014-012).