Metal powders used in additive manufacturing (AM) are the building blocks on which the technique is based. In order to ensure that high quality, safe products are produced, without AM machines being clogged, it is essential that the individual particles within the powders have shapes within certain parameters, the correct size distribution and are free of contaminants.
AZtecAM is a recipe for AZtecFeature, a powerful and flexible particle analysis platform for SEM which is able to characterise all aspects of metal powders used in AM and, as part of the wider AZtec NanoAnalysis suite, provides tools for both the automated and manual investigation of finished products in terms of both compositional and crystallographic variations. AZtecAM is able to perform both morphology only and full compositional and morphological analysis to provide a complete characterisation of AM powders, even in the most challenging scenarios when it is very difficult to identify particles from each other. This process can be completed at speeds in excess of 1,500,000 particles per hour for morphology only characterisation and at rates in excess of 30,000 particles per hour for full morphology + compositional screening.
Here we consider the use of AZtecAM for the complete characterisation of 2 AM powders - Al and Ti based. We demonstrate the measurement of particle morphology across the sample, the detection and identification of contamination and the characterisation of individual particles.
SEM-based Particle Analysis
The scanning electron microscope (SEM) is a powerful tool for the imaging of small particles. By combining the SEM with an energy dispersive X-ray spectroscopy (EDS) system, chemical information can additionally be obtained. A large area Ultim® Max 170 silicon drift detector (SDD) was used with AZtecAM for all examples in this study. This enabled high resolution spectra to be acquired at very high count rates. This meant that short acquisition times could be used for EDS analysis, leading to the very high throughput rates mentioned above. All acquired data was automatically processed with AZtec's Tru-Q™ algorithms to ensure that a quantification of the highest quality was achieved.
Sample Preparation
Powders samples were collected by pressing a stub with a carbon sticky pad against the spread out AM powder. The samples required no additional preparation and were placed directly into the SEM. Fig. 1 shows an example of a sample stub holding AM powder for analysis.
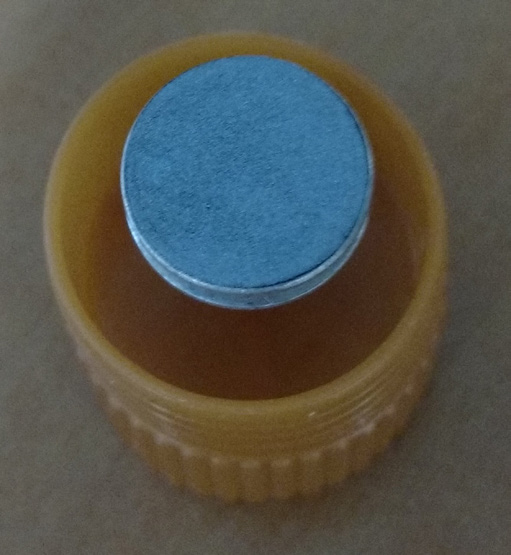
Fig. 1 - Typical sample stub for powder analysis
Particle Morphology Characterisation
The shape of particles can greatly affect the ability of a powder to flow and can also have significant implications on packing density as morphology can affect the way particles are deposited and subsequently melted and fused with the product. This in turn affects the quality of the final product as density variations can be generated. As a result, it is important to perform a characterisation of the morphology of particles within the powder.
AZtecAM identifies all particles from the background using a grey level image threshold. Morphology measurements are performed on all features detected by that threshold.
The complete range of powder sizes used in AM can be measured with AZtecAM. It automatically and simultaneously measures a comprehensive range of morphological parameters: equivalent circular diameter (ECD), perimeter, aspect ratio, area, breadth, direction of long axis, length and shape factor. All of these parameters can be displayed with a range of visualisation tools including histograms and scatter plots. The characterization of both as-received and recycled powders can be performed.
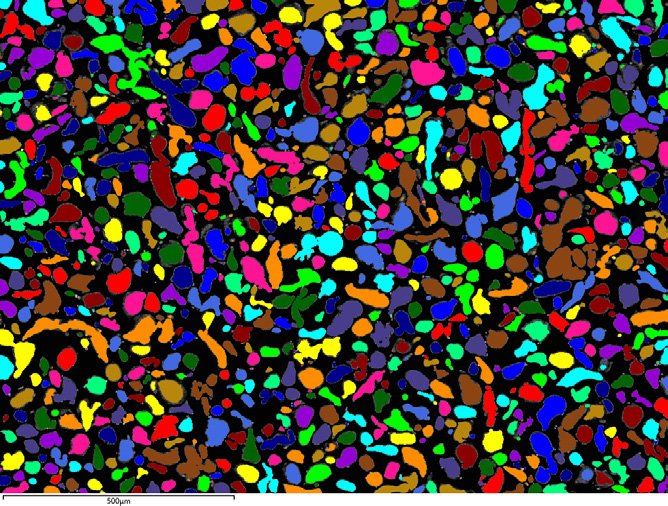
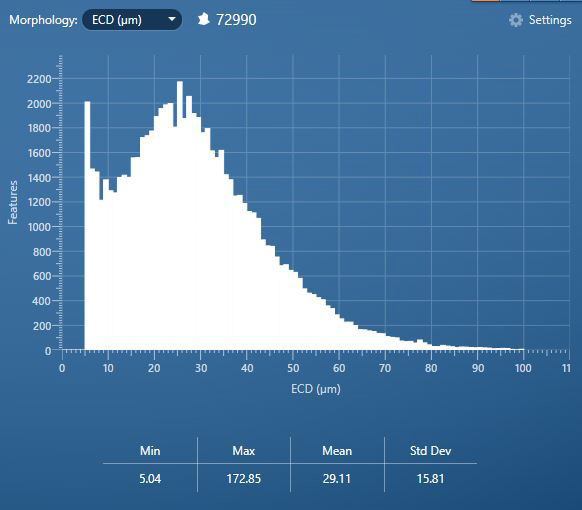
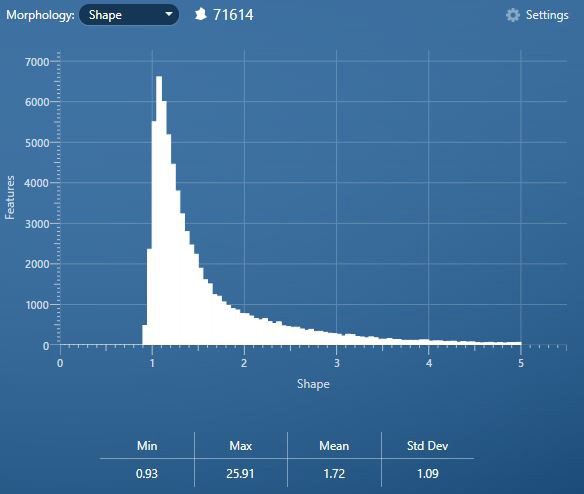
Fig. 2 shows an example of the morphological characterisation of an Al powder sample containing both spherical and elongated particles. The particle size distribution was measured across the complete sample with approximately 72,000 particles detected. Histograms of ECD and shape factor were produced. These can be compared to powder specifications or process requirements to determine if the powder is fit for use.
(a)
(b)
(c)
Fig. 2 - (a) A single field of view showing particles detected (particles in colour). (b) and (c) Histograms of ECD and shape distribution of the entire Al powder sample
Detecting Contamination
The presence of contaminants within an AM product can have severe effects including causing cracking and ultimately failure. This is due to the fact that contaminants may have different physical properties to the main material and consequently may not pack or be processed in the same way as the primary constituent. This leads to weak points in the final product. In applications such as aerospace and medical devices this can have fatal consequences. Therefore contamination control in AM is crucial. A full characterization of AM powders provides an assessment of contaminant sources, therefore enabling preventative or remedial actions to be taken.
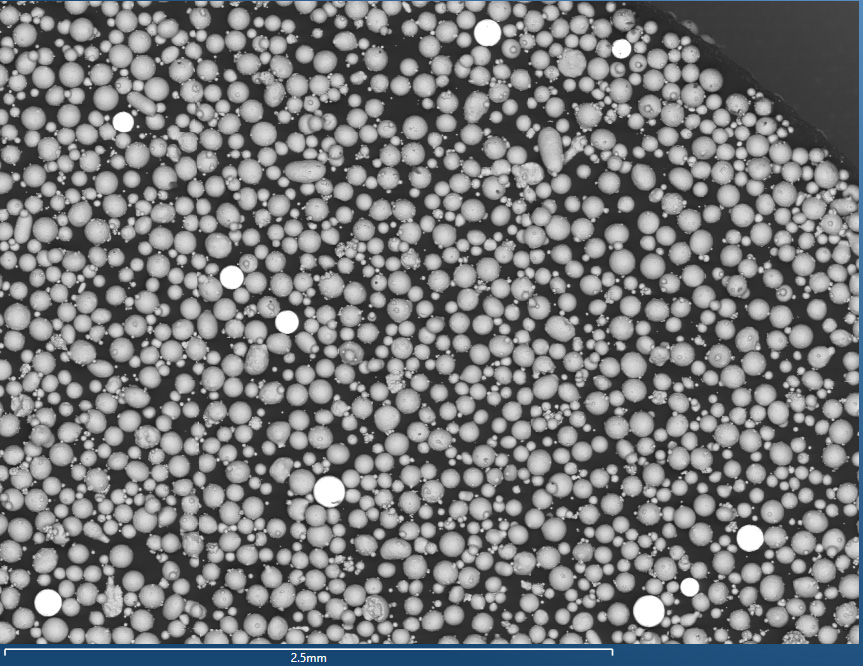
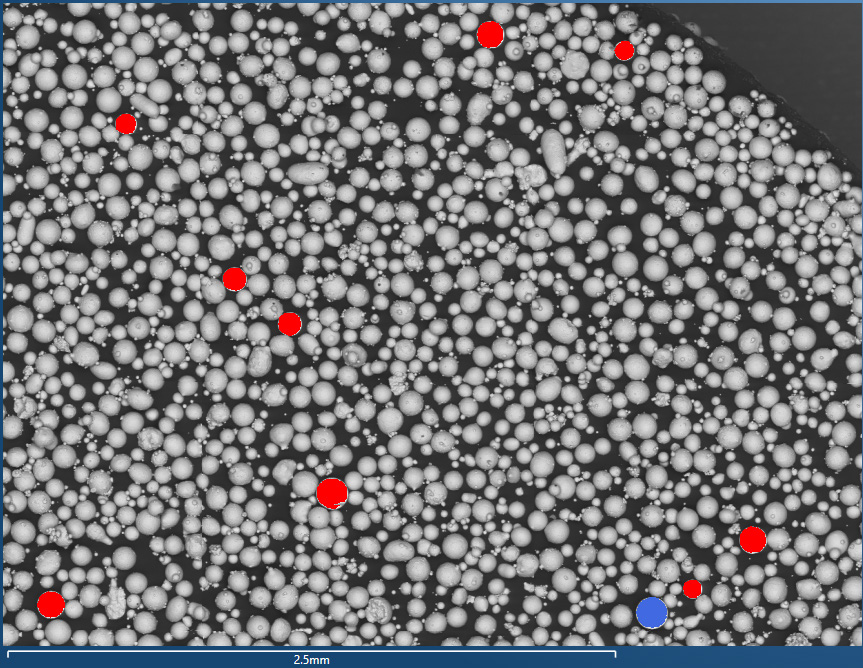
Backscattered electron (BSE) images are often used for the detection and imaging of particles. Contrast in BSE images is generated by differences in the mean atomic number of the materials that the beam passes over with more dense materials typically appearing brighter and less dense particles appearing darker. This makes BSE imaging ideal for locating impurities. By using grey level thresholding to analyse just impurity particles, a measurement of their morphology and composition can be made quickly to both help in determining how dangerous their presence is and their potential source(s).
(a)
(b)
(c)
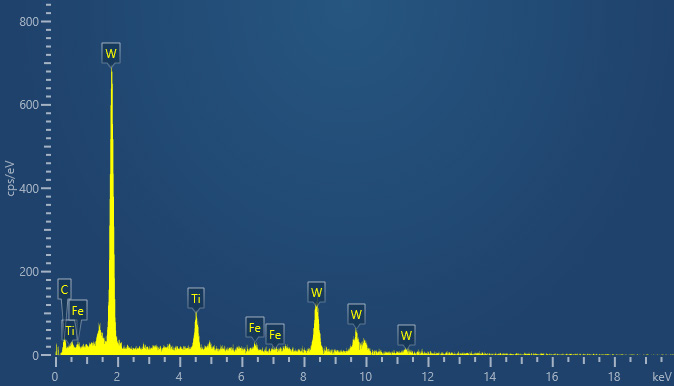
Fig. 3 - (a) BSE Image showing particles in Ti powder sample. (b) Contaminant particles have been detected, analysed and classified and are shown in colour (red - W, blue = WO). (c) Typical spectrum acquired from a W particle
The analysis shown in Fig. 3 can easily be extended to an entire sample stub by setting up an automated large area run with the results from each field combined into a single data set. Both data sets shown in this application note were obtained from a large area run over a total area of 146 mm² at a pixel resolution of 1.4 μm in a time of approximately 24 minutes.
Classification of Contaminant Particles
As soon as EDS data is acquired, the quantified data is classified by a dedicated scheme. This scheme can be easily modified. When this is done, data is immediately and automatically re-classified so that the effect of any changes that have been made can be instantly seen. In the Al powder sample, 107 contaminant particles were detected of 5 contaminant types, see Fig. 4. In the Ti powder sample, 25 contaminant particles were detected all of the same W type, see Fig. 5.
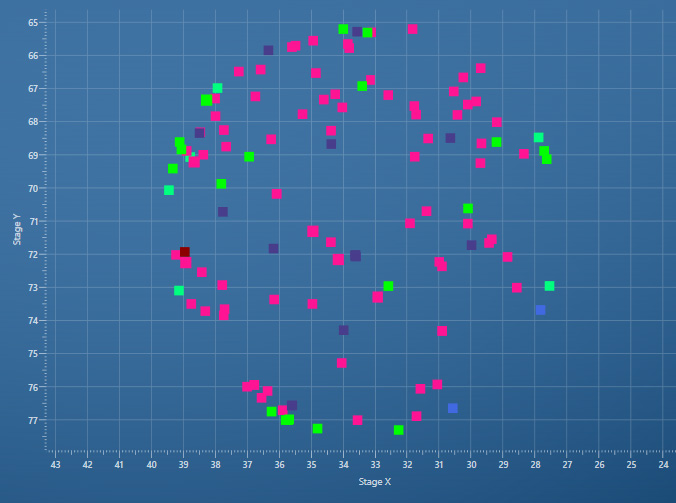
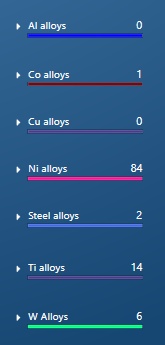
Fig. 4 - Classified distribution of contaminant particles from the Al powder sample
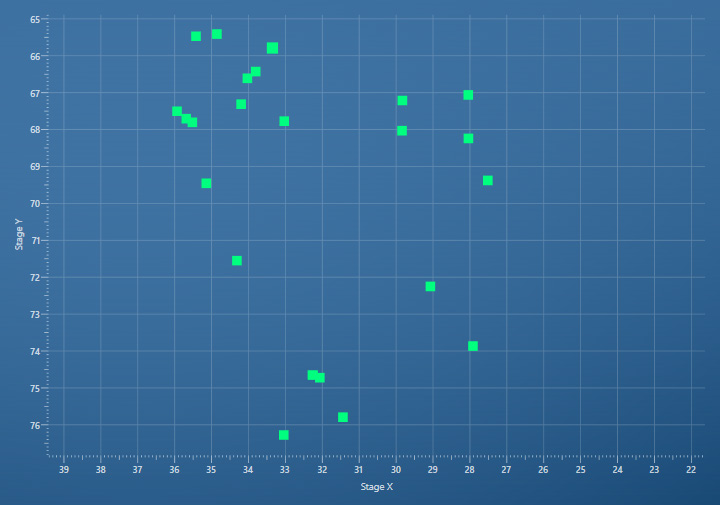
Fig. 5 - Classified distribution of contaminant particles from the Ti powder sample.
Separation of Features that Cannot be Separated with BSE
In an ideal case, contaminant particles have a different density to the metal powder, allowing contrast and brightness to be set so that all contaminant particles can be easily identified with grey level thresholds.
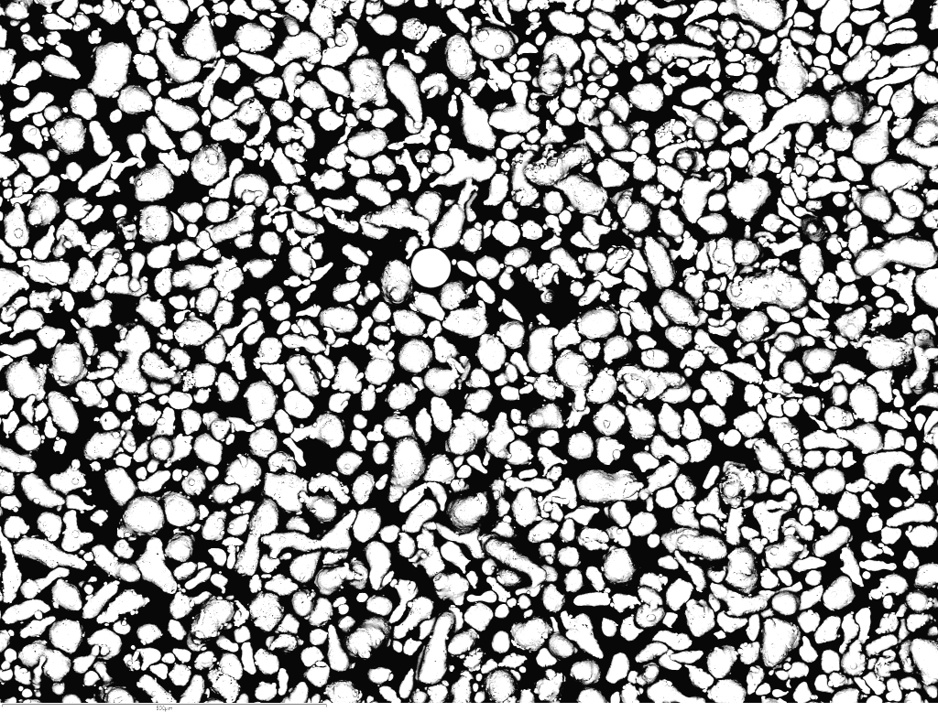
However, in some cases, contaminant particles may have similar BSE image grey levels to the bulk powder, making it impossible to identify them from the powder by grey level. Fig. 6a shows an example of this. In such a case, it is impossible to know if any contaminant particles are present.
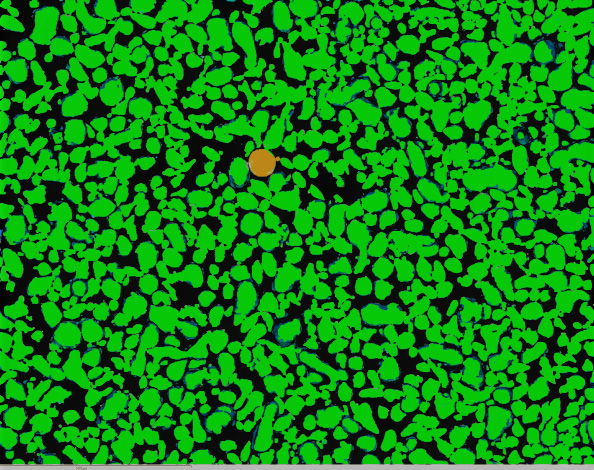
AZtec FeaturePhase, which is packed with AZtecAM, offers a solution to this problem. EDS maps can be automatically collected from the pixels within the grey level threshold that is associated with particles. By mapping only these pixels a large amount of time is saved compared to mapping an entire field (i.e. no time is wasted mapping the mounting medium). A robust, automatic phase identification algorithm analyses these maps to identify phases which are then extracted as features. These Features have their morphology measured, their composition quantified and are classified.
By utilising FeaturePhase to analyse the particles in Fig. 6a, it is possible to determine that one impurity particle (TiO) is present within the field, as shown in Fig. 6b. This information would have been lost without FeaturePhase.
(a)
(b)
Fig. 6 - All particles appear from the BSE image (a) as having the same grey level, when the field is mapped and processed with FeaturePhase (b) it is evident that one contaminant particle is present
Individual Particle Characterisation
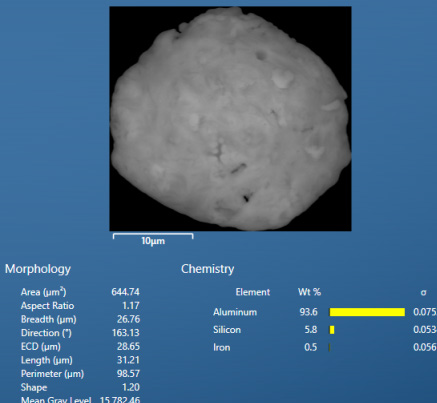
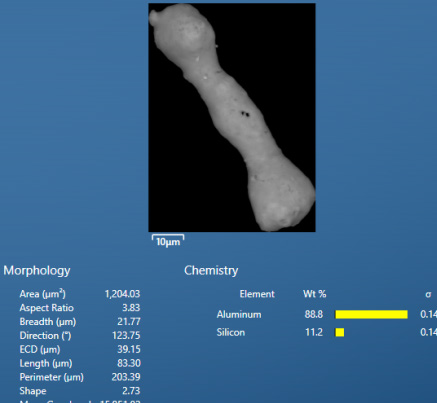
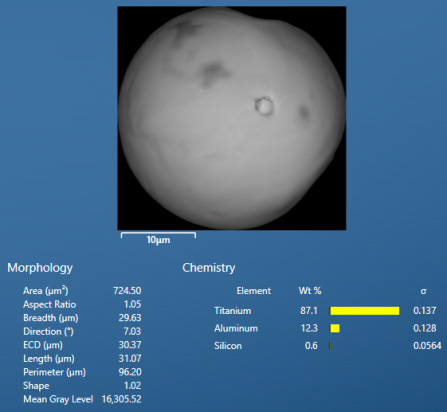
When characterising powders or contaminants within them, there are often specific particles which need to be reported on in greater detail. This may be to show the features of ideal particles or report on contaminants so that supply issues can be rectified. In order to support this, AZtecAM allows users to automatically relocate particles of interest for more in-depth analysis or high quality imaging with optimised SEM/EDS settings and create reports containing individual particle images, particle parameters, and chemistry composition.
Fig. 7 shows examples of morphology and composition analysis of spherical and elongated particles and a contaminant particle found in the Al powder sample.
(a)
(b)
(c)
Fig. 7 - Individual particle image, morphology parameters and composition of (a) typical spherical Al powder, (b) elongated Al powder and (c) contaminant Ti particle in the Al powder sample
Conclusion
Here we have shown that AZtecAM is a powerful tool for the analysis of all aspects of AM powder samples. By utilising large area Ultim Max SDDs, fully quantified compositional data is obtained and processed at the highest possible speeds making the analysis of large areas timely and efficient. Instant feedback and ease of use throughout ensures that both novice and expert users can get the most from their samples immediately. FeaturePhase enables phases which are difficult to distinguish by normal means to be automatically and accurately separated.

