Application Notes
The advantages of whole core NMR measurements
Published: 03 Nov 2026 · Last updated: 03 Nov 2026
This Application Note was created in collaboration with Green Imaging Technologies

Introduction
Most core analysis is performed on plug samples drilled from lengths of whole core extracted from the well bore. Typically, these plugs are taken at strategic locations along the core and are 1" or 1.5" in diameter and typically 2" in length. Depending on rock type, plugging a core can be a challenge due to cracking, fracturing, or even pulverization by the plugging drill bit; it can be difficult to obtain proper cylindrical core plugs of sufficient length. Additionally, friction between the bit and the core can generate considerable heat which can cause fluids in the preserved rock to evaporate which could yield problems with saturation measurements. Obtaining plugs from whole core can involve drilling fluids that can change the original saturation. Furthermore, depending on the plugging interval, core plugs can be affected by heterogeneity, skewing the description of the core and upscaling efforts. For these reasons, the ability to measure porosity and saturations continuously along a larger, whole core is advantageous compared to measuring discrete plug samples, especially when trying to match core to well logs.
Measurement of long samples
However, using the whole core comes with its own set of unique challenges: a larger NMR spectrometer is required, increasing complexity with moving the bulk core through the NMR field of view, and sample preparation is more difficult because of its increased size. Beyond these practical challenges, NMR measurements on long samples are not straightforward. When a sample is longer than the field of view (FOV) of the NMR probe, signal from outside the FOV can be folded in, meaning it is inadvertently included in the NMR measurement. In the case of bulk measurements (such as T2 distributions) this folding in leads to an overestimate of the observed signal. For imaging measurements, such as one-dimensional saturation profiles (Halse et al. 2003), (Li et al., 2009) the folded in signal can lead to unusable images due to destructive interference between the signal from within the FOV and the signal folded in from outside the FOV.
For this reason, a specialized pulse sequence (Vashaee et al., 2014) which suppresses signal folding in from outside the FOV has been developed and applied to both bulk and imaging NMR measurements.
Pulse sequence and results
Figure 1 shows the pulse sequences employed to suppress the signal from outside the FOV. The out of field suppression is accomplished using a combination of an adiabatic inversion pulse and slice selective gradient pulse. The gradient pulse ensures that the adiabatic pulse is only applied to nuclear spins within a selected slice. This eliminates any contributions from out of view signal. Then the adiabatic inversion pulse (hyperbolic secant pulse (Vashaee et al., 2014)) ensures correct inversion even in the presence of radio-frequency (RF) inhomogeneity due to limitations of the RF coil. Following the slice selective adiabatic inversion either a Double Half K (DHK) Sprite pulse sequence (Halse et al., 2003) is used to image the sample (Figure 1 – left-hand side) or a CPMG pulse sequence is employed to recover the pore size distribution (Figure 1 – right-hand side).
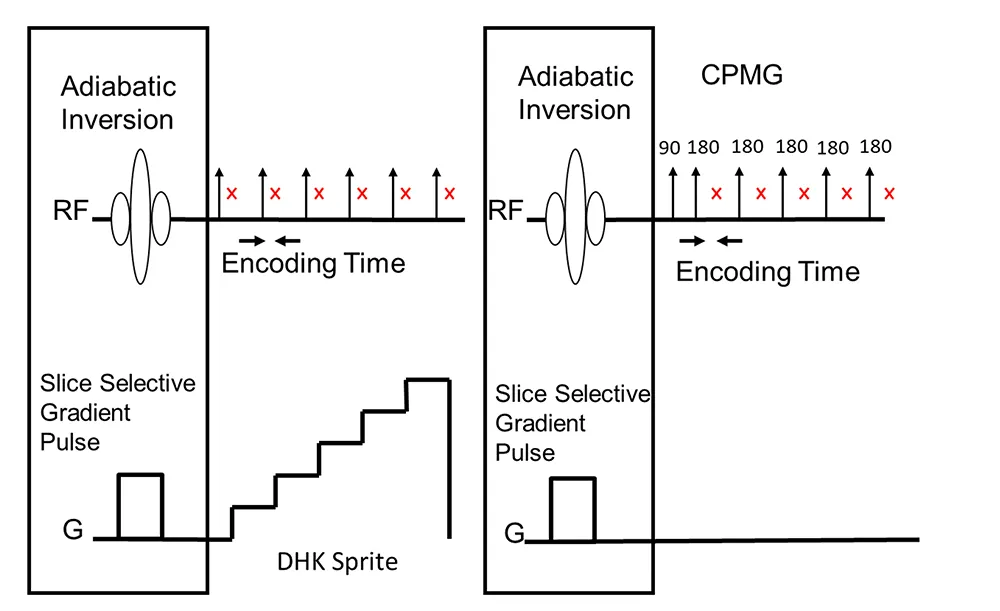
Fig. 1 — The pulse sequences employed to suppress the signal from outside the FOV. The out of field suppression is accomplished using a combination of an adiabatic inversion pulse and slice selective gradient pulse. Following the slice selective adiabatic inversion either a Double Half K (DHK) Sprite pulse sequence is used to image the sample (left-hand side) or a CPMG pulse sequence is employed to recover the pore size distribution (right-hand side).
The out of volume suppression is accomplished via a two-step process. For example, for a one-dimensional saturation profile, two profiles, one regular (without a slice selective inversion pulse) and one with a spatially selective inversion pulse on the front end (Vashaee et al., 2014) are recorded. The two profiles are then subtracted (in the time domain) and only signals from within the selected inversion slice are added, all other signals are subtracted. This technique doubles the scan time, although the extra scan increases signal to noise by a factor of the square root of two. This is because in the volume of interest, the signal is measured twice (once with the normal saturation profile and once with the spatially selective inversion pulse).
Figure 2 compares the saturation profiles with and without out of field suppression. The black trace in Figure 2 shows a saturation profile acquired on the long core sample without the out of volume suppression turned on. As expected, this profile is unusable as there is clearly destructive interference between the signal from within the FOV and the signal folded in from outside the FOV. The red trace is a saturation profile of a long core sample with out of field suppression. In this profile, the region of interest is chosen as 11.2 cm or eighty percent (80%) of the field of view (14 cm). Also shown in Figure 2 (blue trace) is a saturation profile recorded on a short core sample without the suppression technique applied. Out of volume suppression was not necessary with this shorter sample as it did not extend beyond the FOV of the probe. The good agreement between the porosity per cm of both the long and short core samples confirms that out of volume suppression techniques give accurate results.
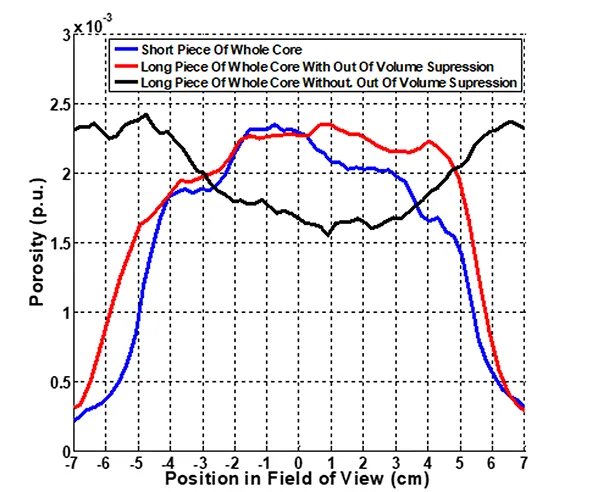
Fig. 2 — Comparison of the saturation profiles with and without out of field suppression. The black trace shows a saturation profile acquired on the long core sample without the out of volume suppression turned on. The blue trace is a saturation profile recorded on the short core sample without the suppression technique applied. The red trace is the saturation profile recorded for the long core sample with the out of volume suppression measurement.
Figure 3 compares T2 distributions measured with and without out of field suppression on a doped water sample. The sample was 2.5 cm in diameter and much longer than the 7 cm FOV of the magnet. Based on geometry, the expected volume of the sample should be 34.36 ml. The black trace shows the observed signal measured without out of field suppression. The observed volume for this data is 55.67 ml which greatly exceeds the expected volume as a result of signal folded in from outside the FOV. The red trace shows the T2 distribution measured with out of field suppression. In this case, the area of interest was set equal to the FOV of the magnet. The observed volume (34.04 ml) agrees well with the expected volume (34.36 ml) indicating that the out of field suppression is working well at eliminating contributions from beyond the field of view. Finally, the blue trace shows a T2 distribution where the area of interest was set smaller than the FOV of the magnet.
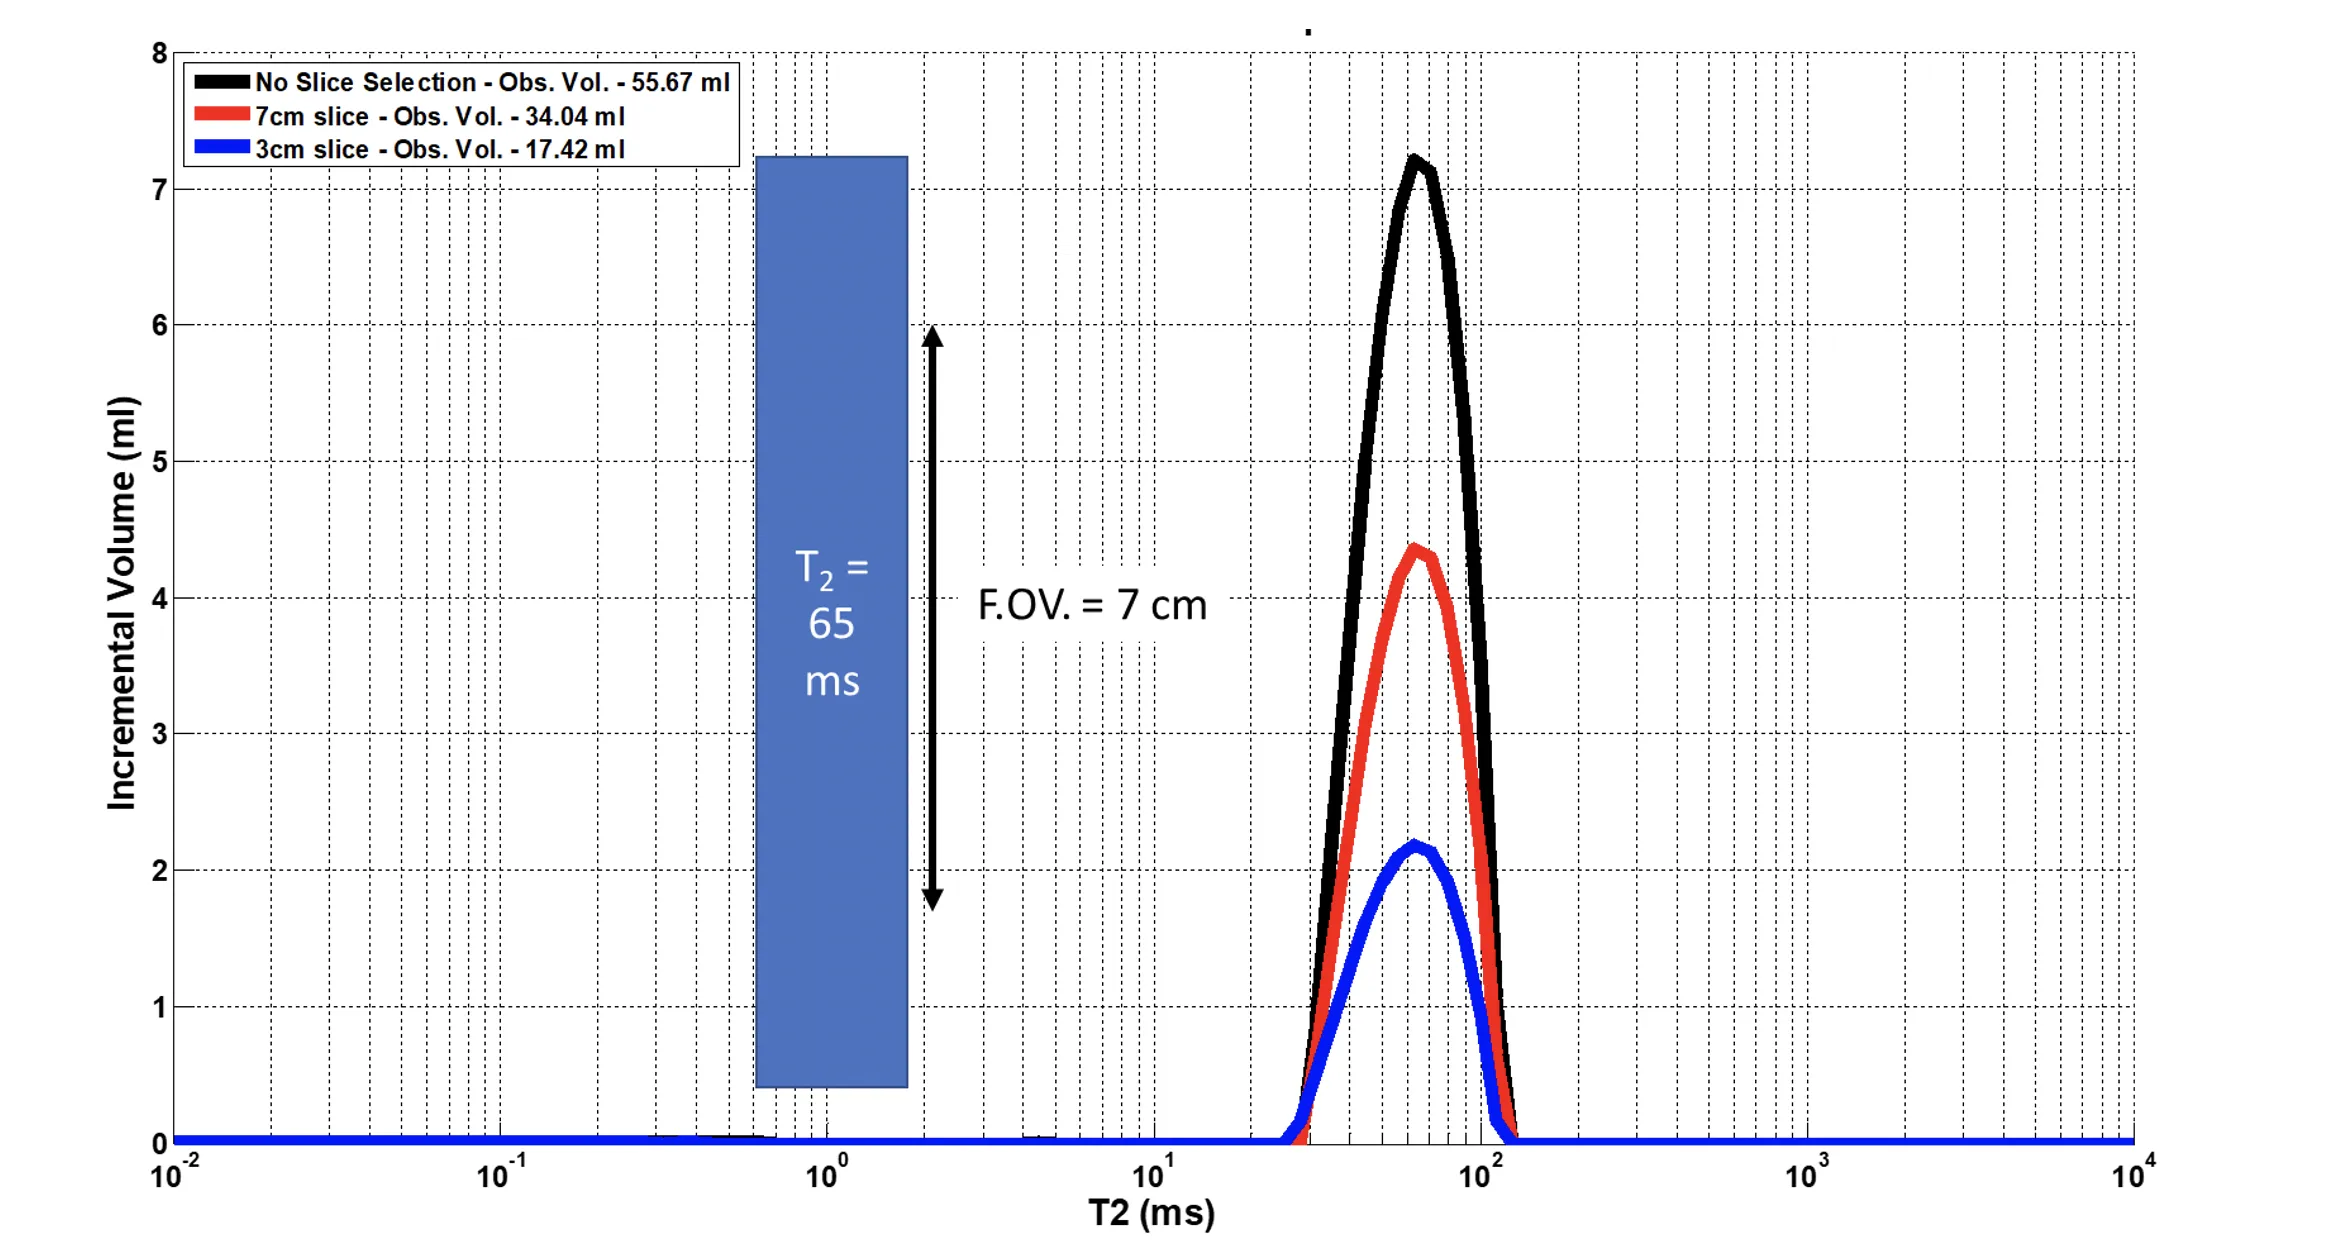
Fig. 3 — Comparison of T2 distributions measured with and without out of field suppression on a doped water sample. The black trace shows the observed signal measured without out of field suppression; the observed signal exceeds the expected signal based on the FOV of the magnet. The red trace shows the T2 distribution measured with out of field suppression and the area of interest set equal to the FOV of the magnet. The observed volume agrees well with the expected volume. The blue trace shows a T2 distribution where the area of interest was set smaller than the FOV of the magnet.
Conclusion
NMR measurements on complete whole core samples are preferable to measurements on plugs for a variety of reasons. The practical and experimental problems of making measurements on long, whole core samples have been addressed in this Application Note and shown to be solvable through pulse sequence suppression of interfering signals. While the practical challenges of handling a much larger sample, including the need for much larger NMR probes and instruments, remain, these challenges are solvable through engineering.
References
- Halse M., Goodyear D. J., MacMillan B., Szomolanyi P., Matheson D. and Balcom B. J. (2003). Centric scan SPRITE magnetic resonance imaging. Journal of Magnetic Resonance., 165, 219–29.
- L. Li, H. Han and B. Balcom, (2009). Spin echo SPI methods for quantitative analysis of fluids in porous media methane storage capacity in organic-rich shales. Journal of Magnetic Resonance, 198, 252–260.
- S. Vashaee, O.V. Petrov, B.J. Balcom, and B. Newling (2014). Region of Interest Selection of Long Core Plug Samples by Magnetic Resonance Imaging: Profiling and Local T2 measurement. Measurement Science and Technology, 25, 1–10.