Introduction
Technical cleanliness is a crucial quality assurance and quality control process for several industries including aerospace, automotive and any others involved in the manufacture of mechanical devices. It aims to find and determine the types and ultimately origins of particles generated by manufacturing. The properties of those particles have the potential to significantly affect the performance of finished products; as such, finding and identifying them allows corrective actions to be taken and ultimately leads to improved products.
Here, we demonstrate how a scanning electron microscope + EDS based workflow (in this case a Hitachi TM4000PlusIII tabletop microscope equipped with an XploreCompact65 EDS detector from Oxford Instruments) is an ideal platform for the technical cleanliness analysis workflow. We will show how both morphological and compositional data can be collected in an automated, single analysis run within a short timeframe and with minimum operator time to the requirements of VDA 19.1:2026.

Figure 1 Gearbox debris: particle clusters concentrated on moving parts.
Technical Cleanliness Analysis with AZtecClean to VDA 19.1 2026
Analysing problematic particles is key to improving processes as it gives a chance of identifying the source. AZtecClean, built on the AZtecFeature particle analysis platform, acts as a recipe that optimises all the analytical and data-processing settings needed for comprehensive technical cleanliness analysis.
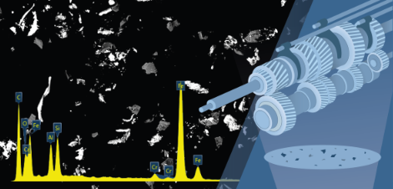
Figure 2 AZtecClean - user profile for technical cleanliness.
It automates:
- Particle detection,
- Morphology measurement,
- Compositional analysis
- Classification
And includes workflows for rapid reporting.
AZtecClean includes dedicated user profiles for both ISO16232 and VDA 19.1 2026 and is designed to meet the specific requirements of each of those standards.
As such, in the case of VDA19.1 2026, it includes:
- Particle detection settings
- EDS measurement settings
- A classification scheme built to the requirements of the standard
- Functionalities to meet the “Zero element rules” requirements of the standard
- Automated reconstruction of particles that cross field boundaries – to ensure correct particle morphologies and composition are recorded
- A tool to calculate component cleanliness codes
- Step notes to guide users through the analysis process
- Technical cleanliness-specific reporting
- In addition to the complete range of advanced particle analysis tools available in AZtecFeature.
Analysis
A representative area of a technical cleanliness filter sample was analysed to demonstrate system performance. The details of the analysis area and run are as follows:
- Dimensions: 10 x 10mm (approx.)
- Area: 56 fields
- A montage of the completed, analysed area is shown in Figure 3 below.
- Particles: 2860
- Analysis time: 0.01sper particle.
- Total run time: 12.1 minutes.
All acquired EDS spectra were processed with AZtecLive’s TruQ IQ algorithms which ensure accurate elemental identification, correction for unavoidable artefacts arising from the physics of the analysis process and subsequent quantification of the composition of the feature. These algorithms are critical to obtaining correct results as all further classification and data processing is based upon them.
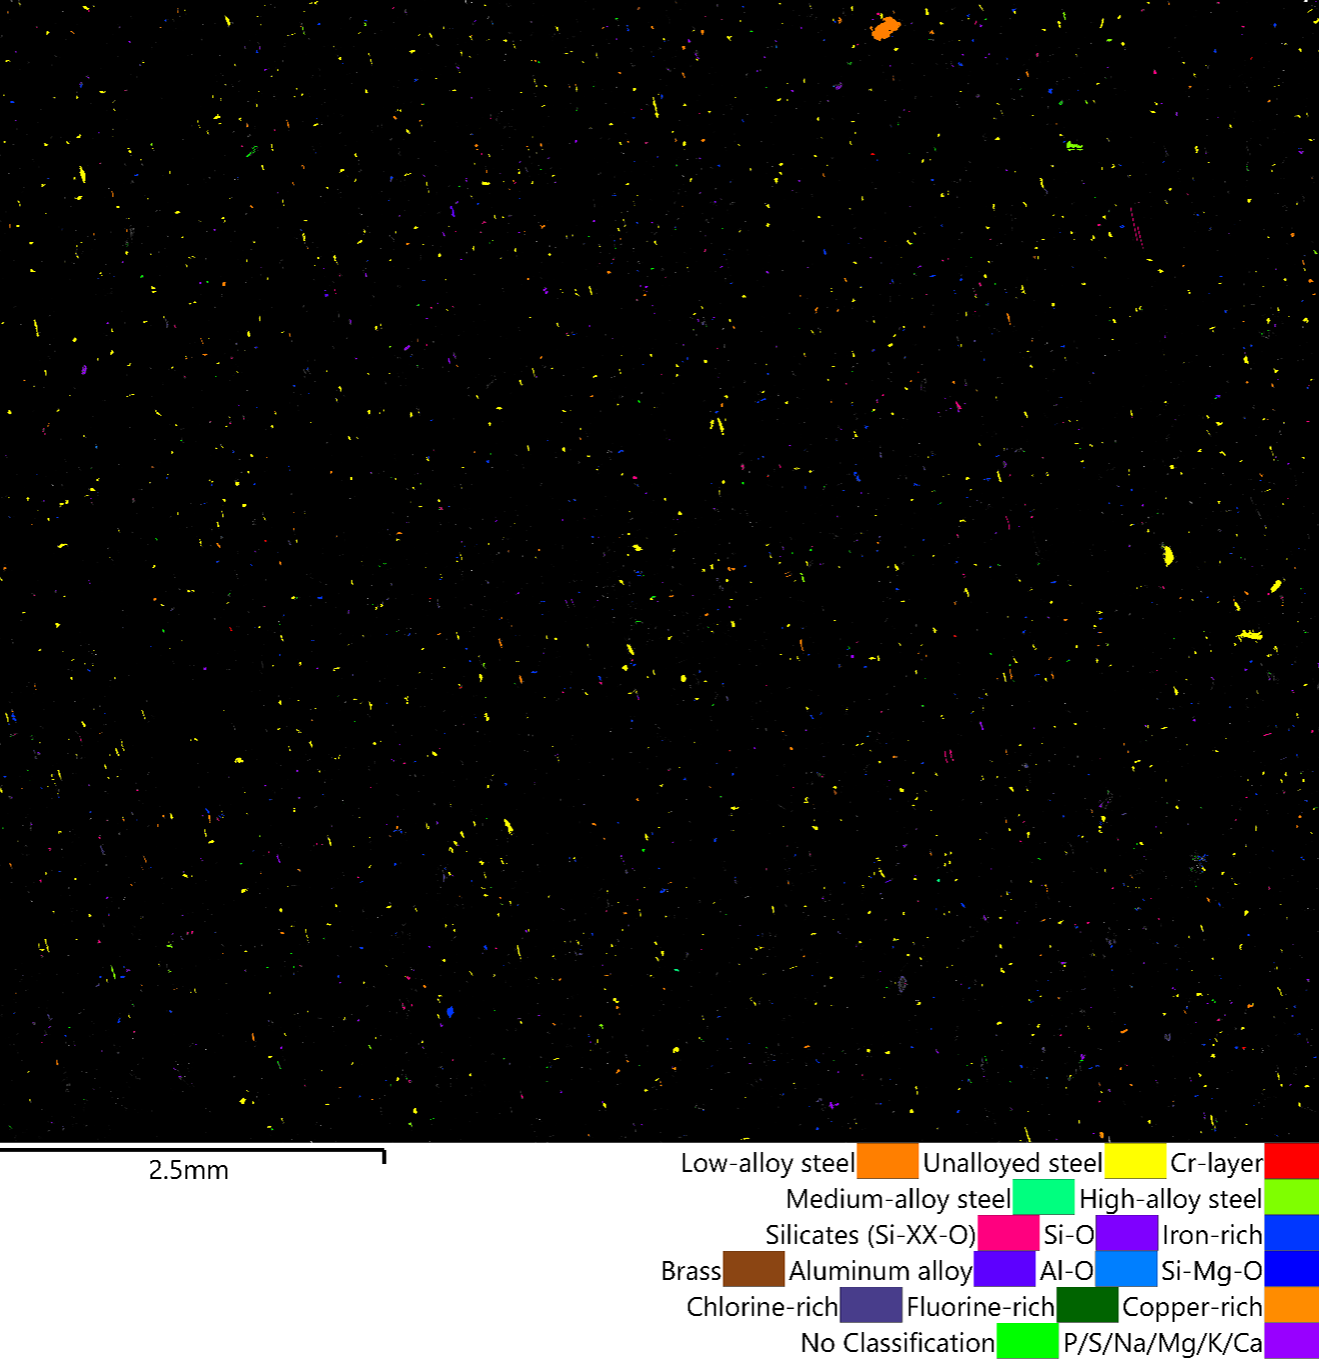
Figure 3 Montaged image of the total analysed area (56 fields). 2860 particles were analysed and classified to the requirements of the VDA 19.1:2026 classification scheme (legend).
Results
All analysed particles were automatically classified to the requirements of VDA19.1 2026 during the automated run. The results of this classification can be seen in Figure 4. The majority of detected particles were found to be unalloyed steel (1639), with the second most abundant phase being P/S/Na/Mg/K/Ca particles (284), followed by low-alloy steel (275). This classification scheme used was factory-supplied but can be edited at any time should the user desire to add additional classes or subclasses.
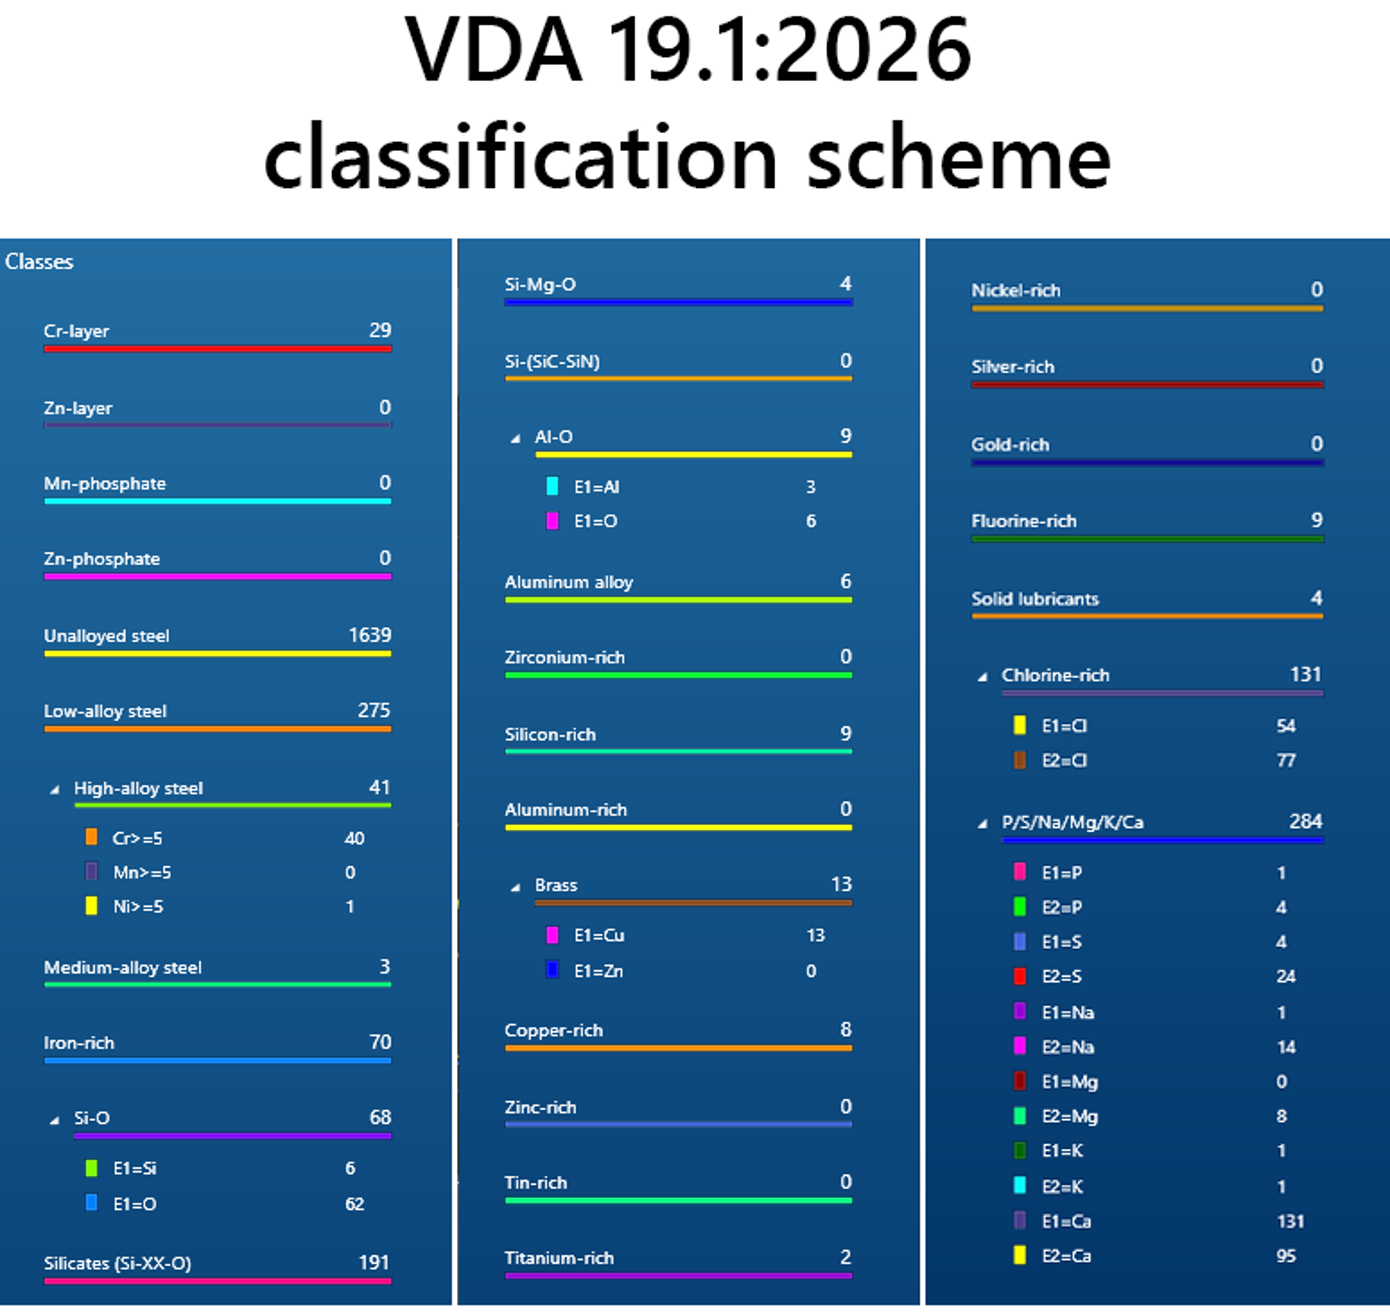
Figure 4 Particle classification results based on VDA 19.1:2026.
This rich source of information is potentially invaluable as it could immediately be used in an investigation to determine potential particle sources, thereby driving corrective actions. Further routine runs could then be implemented to continuously monitor any future changes in particle populations to ensure no drop in quality.
Reporting
Comprehensive reporting following the VDA 19.1:2026 requirements was performed on the acquired data. Classification summaries, component cleanliness code calculations (Figure 5) and particle size distributions (Figure 6) were all automatically performed.

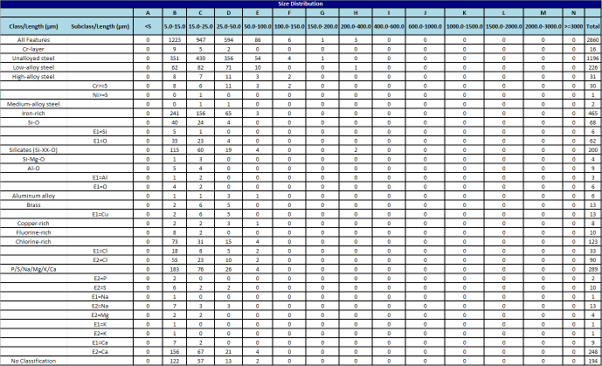
Figure 5 Report: Component cleanliness code (ccc) and size distribution table.
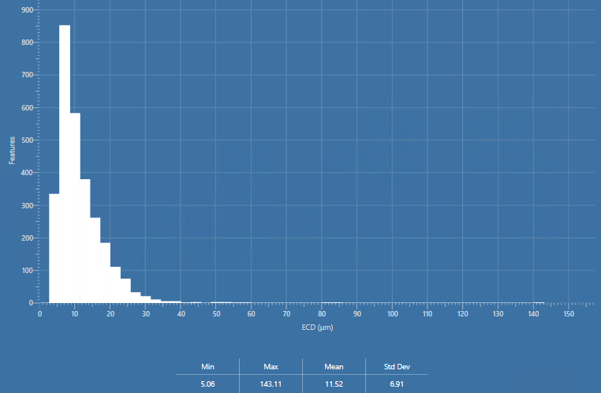
Figure 6 Histogram showing the size spread of the 2860 analysed particles in ECD (μm).
Conclusions
In this example, a typical technical cleanliness filter sample was analysed to the requirements of VDA 19.1:2026. 2860 particles were detected, analysed (morphology & composition), processed and classified to the requirements of the latest version of the standard. TruQ IQ algorithms were used to ensure that the highest quality of data was acquired.
The data collected here was collected on a tabletop microscope and demonstrates the high level of efficiency that can be achieved on such an instrument. The same analysis could be performed on full size instruments with larger EDS detectors at an associated level of performance.

