Application Notes
T1 and T2 Correlation for Fluid Typing and Quantification
Published: 03 Nov 2026 · Last updated: 03 Nov 2026
This Application Note was created in collaboration with Green Imaging Technologies

Introduction
In recent years, lab based NMR core analysis researchers have begun to take advantage of enhanced signal-to-noise ratios (SNR) and shorter tau values to implement more data rich measurement techniques. In the past, extremely long acquisition times for T1-T2 maps, or correlation plots, made them next to impossible to obtain. Current SNR levels have removed this limitation and have allowed researchers to begin exploring what can be learned from these maps.
Here, we show how T1-T2 maps can be used to differentiate fluids with different viscosities. We demonstrate how water and bitumen can be discriminated with T1-T2 maps in representative shale formations. Further, we show how measuring T1 and T2 at different temperatures allows us to differentiate between components of varying viscosity.
Method
Initial inversion recovery CPMG T1-T2 measurements were obtained on six shale samples in the as received state. The samples were then placed in brine under 2,000 psi of pressure for 48 hours to fully saturate the samples and the inversion recovery CPMG T1-T2 measurements were repeated. All measurements were performed on an Oxford Instruments GeoSpec2 2/75 2 MHz spectrometer with a 40 mm probe.
The as received T1-T2 measurement was then subtracted from the fully saturated T1-T2 measurement to give the net T1-T2 measurement.
(Figure 1, below panel). All measurements were performed on an Oxford Instruments GeoSpec2 2/75 2 MHz spectrometer with a 40 mm probe.
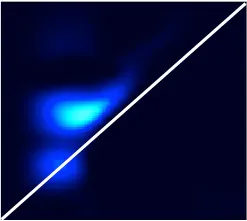
As recieved
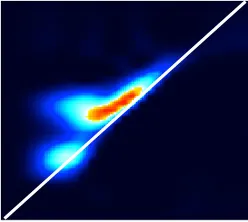
Fully saturated
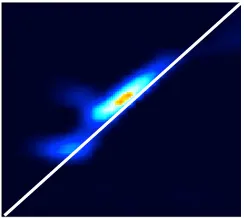
Net
Fig. 1 — T1-T2 maps of shale core in various conditions: as received (bottom), fully saturated (middle), and net (top).
Results
The T1/T2 ratio can be used to determine the origins of the signal in net T1-T2 maps [1]. In fluids with low viscosities, T1 and T2 are similar, but as viscosity increases T1 and T2 will deviate [2]. Higher ratios indicate more viscous materials such as bitumen while lower ratio contributions are likely due to water. In the T1-T2 maps of Figure 1, high signal intensity is red while low intensity is shown in blue. The white diagonal line represents a T1/T2 ratio of 1:1.
Temperature Studies
Solid Wax
An initial measurement was taken on a solid wax sample at 35°C. Figure 2 shows T1-T2 maps of wax at different temperatures. The T1-T2 map shows signal at a high T1/T2 ratio indicating a highly viscous material. When the sample was heated to 45°C the signal spread to lower T1/T2 ratios. At a temperature of 70°C the sample was liquefied and the signal was present around the 2:1 line.
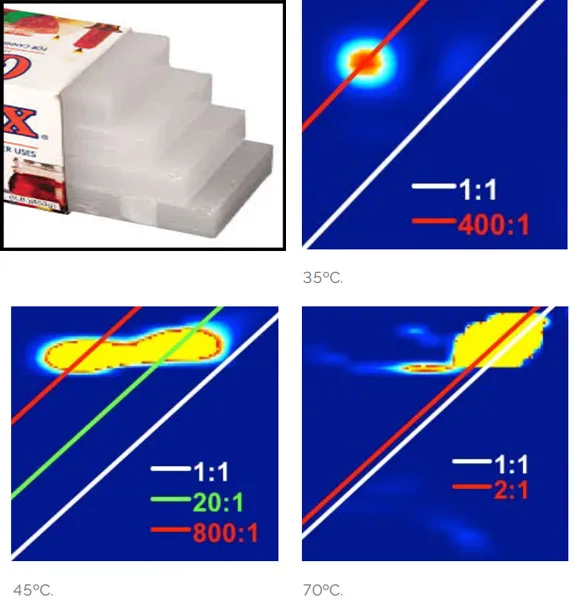
Fig. 2 — T1-T2 maps of wax at various temperatures (35°C, 45°C, and 70°C).
Ozocerite
Figure 3 shows similar studies performed on ozocerite, a naturally occurring bitumen. At 35°C, signal appeared along the 20:1 line and at 70°C an extended signal area appeared near the 1:1 line. When the material becomes less viscous the T1/T2 ratio shifts to lower values.
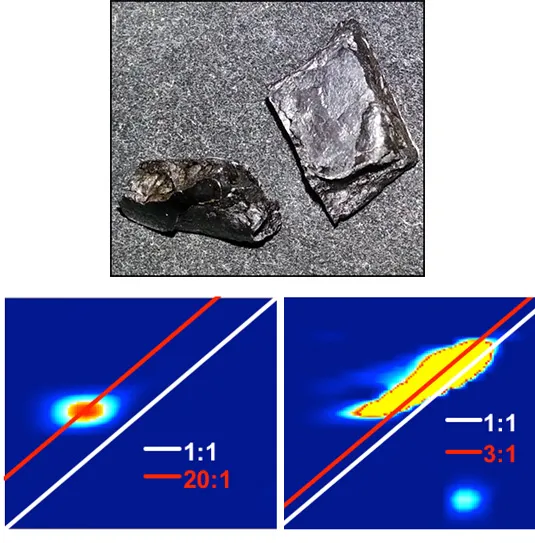
Fig. 3 — T1-T2 maps of ozocerite at various temperatures (35°C and 70°C).
Further temperature studies were performed on a group of eight shale samples. As with the previous studies, T1-T2 maps were acquired but in this study the temperatures were 35°C, 65°C, and 110°C. Figure 4 shows a representative shale sample at these three temperatures. In the top panel, we see the results at 35°C with the bitumen populations appearing in the 10:1 to 100:1 ratio range and the water peak nearer the 1:1 ratio line. In the middle panel, the results at 65°C are shown. The two peaks begin to separate but show very little change. At 110°C (bottom panel) the water has begun to dissipate indicating drying. The bitumen peak also decreases, moving towards the 1:1 ratio line, indicating a change in viscosity.
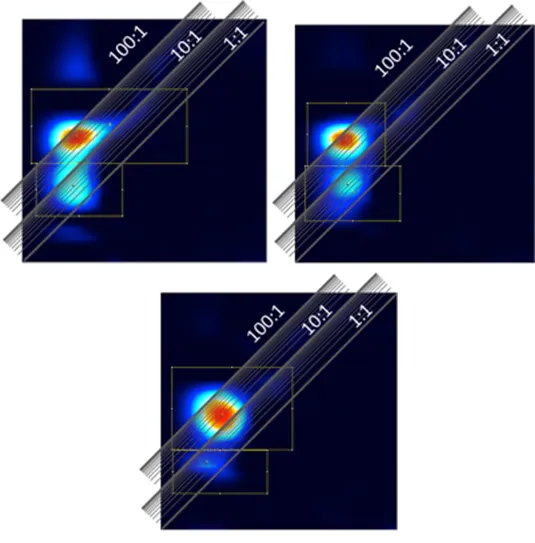
Fig. 4 — T1-T2 maps of shale at various temperatures (35°C, 65°C, and 110°C).
References
- E. Rylander, P. M. Singer, T. Jiang, R. Lewis, R. McLin, S. Sinclair, SPE-164554 (2013).
- N. Bloembergen, E. M. Purcell and R. V. Pound, Nature
- , 160, 475-476 (1947).
- Ali Tinni, 2013, personal communication
- . Work was supported by the Unconventional Shale Gas Consortium at the Mewbourne School of Petroleum and Geological Engineering, the University of Oklahoma.