SWIR spectroscopy is a powerful tool for characterising functionalised molecules, biosensors, and biomarkers used in
biomedical research. By combining sensitive detection in the second near-infrared window (NIR-II, ~1000-1700 nm) with
techniques such as fluorescence and Raman spectroscopy, researchers can investigate molecular interactions, probe
biological processes, and extract clinically relevant information from complex samples. This article highlights three
recent studies that demonstrate the breadth of SWIR-enabled characterisation: an NIR-II carbon nanotube biosensor for
detecting amyloid beta associated with Alzheimer's disease, a mechanistic study revealing how carbon nanotube
biosensors generate optical signals, and a label-free Raman approach for assessing breast tumour margins during
surgery. In addition, the article discusses measurement considerations that influence the choice of SWIR spectroscopy
detectors and spectrograph configuration. Together, these examples illustrate how advanced spectroscopy in the
NIR-II/SWIR region supports biomarker development, biosensor optimisation, and biomedical diagnostics.
SWIR spectroscopy for biosensor and biomarker characterisation
New and improved biosensors and biomarkers form the basis for developing next-generation clinical tools required for
in situ and in vivo medical diagnostics, cancer and disease screening, image-guided surgery, and
targeted drug delivery. Key research targets include functionalised carbon nanotubes, biocompatible quantum dots,
molecular fluorophores, biosensors, targeted drug carriers, and disease-specific biomarkers that emit in the second
near-infrared window (NIR-II, ~1000-1700 nm). Compared to approaches using shorter wavelengths, these SWIR-active
probes offer improved sensitivity for biological imaging due to deeper tissue penetration, reduced light scattering,
and lower background autofluorescence.
Accurate characterisation is essential because the optical response of a functionalised molecule or biomarker is
closely linked to its chemical composition, surface chemistry, structural integrity, and interactions with complex
biological environments. Understanding these relationships helps researchers optimise probe performance and
biocompatibility, and support the translation of new diagnostic approaches into clinical use.
Short-wave infrared (SWIR) spectroscopy is a powerful analytical approach for characterising biosensors, biomarkers
and functionalised molecules developed for biomedical research and clinical diagnostics. A range of complementary
spectroscopy techniques can be used to characterise these materials. SWIR fluorescence and photoluminescence
spectroscopy are particularly valuable for evaluating emission characteristics, spectral signatures,
quantum yield, photostability, and environment-dependent optical behaviour. Raman spectroscopy can
provide information on chemical composition, functionalisation, and material quality, and can even detect intrinsic
biochemical signatures without external labels. Reflectance and transmittance measurements can reveal
absorption features and optical interactions relevant to sensing and imaging applications. Together, these techniques
provide a comprehensive picture of the chemical, structural, and optical characteristics that determine the
performance of SWIR-active biomarkers and functionalised molecules in biomedical research and clinical applications.
Spectral range definitions
Short-Wave Infrared (SWIR) refers to the spectral region spanning ~1.0–2.5 µm. In practice, most
SWIR imaging systems operate in the range of ~900–1700 nm, which corresponds to the sensitivity of standard InGaAs
detectors. Extended SWIR systems push sensitivity up to ~2.2–2.5 µm by tuning InGaAs sensor stoichiometry and
manufacturing processes.
In life sciences and biomedical applications, the second near-infrared window (NIR-II), also called
the second biological window, is typically defined as ~1000–1700 nm. Compared to shorter wavelengths, NIR-II light can
probe deeper into tissue with reduced scattering, while background autofluorescence is lower. This enables higher
image contrast and more accurate molecular detection and diagnostics.
This article highlights recent research on biosensors and biomarkers and discusses measurement considerations that
influence the choice of SWIR spectroscopy detectors and spectrograph configurations. The following studies illustrate
how SWIR and NIR-II detection support:
- Developing biosensors for neurodegenerative diseases
- Understanding signal transduction mechanisms in biosensors
- Tumour detection using intrinsic biochemical signatures
Detecting amyloid beta in living cells and mouse brains
Detecting and monitoring amyloid beta (Aβ) accumulation remain central challenges in Alzheimer's disease
research. Toxic Aβ species can accumulate inside cells long before the plaques typically associated with disease
progression become visible. New biosensors capable of detecting Aβ in living cells and organisms could support
mechanistic studies of these early disease processes.
In this study, researchers developed a SWIR-emitting optical nanosensor based on single-walled carbon nanotubes
(SWCNTs) functionalised with Aβ peptides [1]. This biosensor monitored Aβ accumulation in living cells and discriminated between healthy
and Alzheimer's mouse brains in vivo.
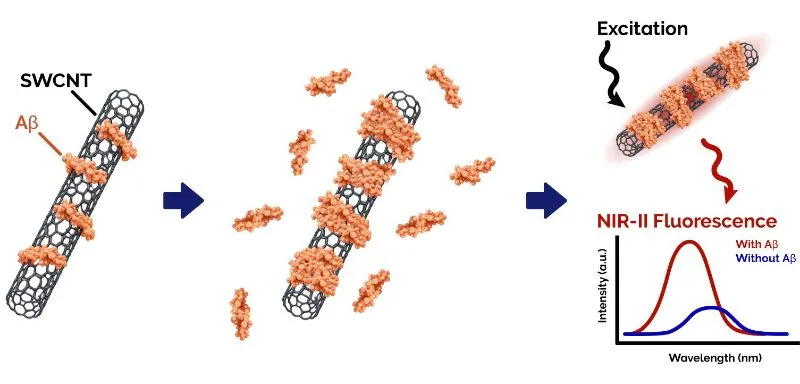
Illustration of the Aβ sensing principle in Aβ-functionalised SWCNT nanosensors. Binding of amyloid beta (Aβ) to the
nanotube surface alters the detected NIR-II fluorescence intensity and emission wavelength.
Using NIR-II fluorescence spectroscopy, the team showed that the functionalised nanotubes' fluorescence intensity
and emission peak wavelength changed upon interacting with Aβ. The nanosensors were able to monitor Aβ accumulation in
different neuronal and immune cell lines. After intracranial injection, they also differentiated between healthy and
Alzheimer's disease mouse models. Using probes emitting in the NIR-II region was particularly beneficial for the
in vivo experiments, as the increased penetration depth and low background fluorescence enabled imaging
beyond the brain surface of live organisms.
For optical characterisation both in vitro and in vivo, the researchers employed SWIR fluorescence
spectroscopy using Oxford Instruments' Shamrock spectrograph and iDus 1.7 μm InGaAs camera, allowing sensitive
detection of SWIR emission from 723 to 1694 nm.
The work demonstrates how NIR-II biosensors can yield biological information that is difficult to obtain with
conventional imaging techniques, particularly when probing dynamic molecular processes in complex tissue environments.
Original publication: Merav Antman-Passig, Eitan Wong, Georgia R. Frost, Christian Cupo, Janki Shah,
Albert Agustinus, Ziyu Chen, Chiara Mancinelli, Maikel Kamel, Thomas Li, Lauren A. Jonas, Yue-Ming Li, Daniel A.
Heller. Optical Nanosensor for Intracellular and Intracranial Detection of Amyloid-Beta. ACS Nano 16 (5):
7269–7283 (2022). https://doi.org/10.1021/acsnano.2c00054
Understanding How Carbon Nanotube Biosensors Generate Optical Signals
For developing biosensors with improved performance, researchers need to understand the mechanisms of analyte
detection and optical signal generation. This study investigated how the binding of target molecules to functionalised
single-walled carbon nanotube (SWCNT) biosensors is converted into a detectable NIR-II fluorescence signal [2].
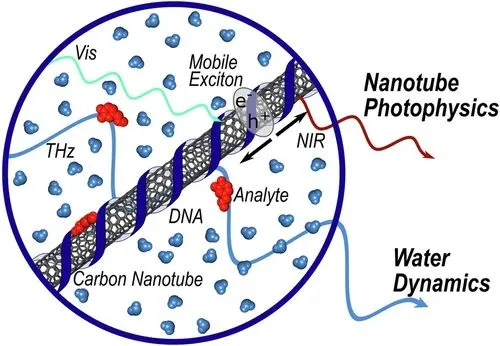
Illustration of SWCNT-based molecular sensors and the spectroscopy techniques used to study how molecular
interactions are converted into optical signals. NIR fluorescence spectroscopy monitors the sensor response, while THz
spectroscopy probes changes in the surrounding water environment. Reproduced from "Fluorescence
changes in carbon nanotube sensors correlate with THz absorption of hydration", Nat.
Commun. 15
(2024), by Sanjana S. Nalige, Phillip Galonska et al., licensed under CC BY 4.0.
The researchers investigated the NIR fluorescence changes in DNA-functionalised SWCNTs upon binding to the analytes
dopamine and riboflavin. To uncover the sensing mechanism, they combined SWIR fluorescence spectroscopy with terahertz
(THz) spectroscopy and molecular dynamics simulations. They discovered that changes in the SWCNTs' hydration layer
upon analyte binding correlate directly with changes in fluorescence intensity. The results suggest that interactions
of nanotube excitons with nearby water molecules play a central role in determining sensor response.
NIR-II fluorescence measurements were performed using an Oxford Instruments Kymera 193i spectrograph and iDus InGaAs
491 detector, allowing sensitive detection of subtle fluorescence changes associated with analyte binding.
The study provides insights into how SWCNT biosensors convert molecular interactions into optical signals, which can
help design and optimise new biosensors.
Original publication: Nalige, S.S., Galonska, P., Kelich, P. et al. Fluorescence changes in carbon
nanotube sensors correlate with THz absorption of hydration. Nat. Commun. 15, 6770 (2024). https://doi.org/10.1038/s41467-024-50968-9
High-Wavenumber Raman Spectroscopy for Label-Free Assessment of Breast Tumour Margins
Accurately defining tumour margins during breast-conserving surgery remains a significant clinical challenge. If the
cancerous tissue is not removed completely, patients may require additional surgery. At the same time, surgeons aim to
remove as little healthy tissue as possible. Fast and reliable methods for identifying tumour boundaries can help
surgeons make decisions directly in the operating room and improve the outcome for patients.
In this study, researchers used Raman spectroscopy to distinguish healthy from cancerous breast tissue based on
biochemical composition [3]. Rather than relying on fluorescent labels or contrast agents, the method measured intrinsic
molecular signals from lipids, proteins and water within the tissue.
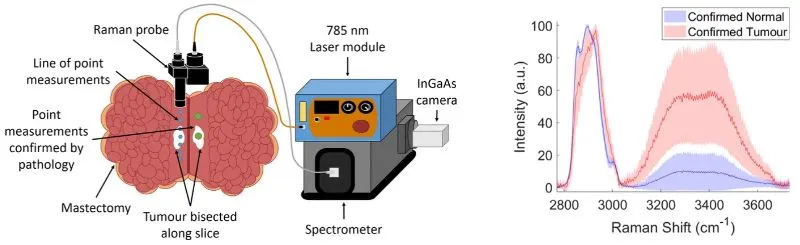
High-wavenumber Raman spectroscopy for distinguishing healthy and tumour breast tissue. Illustration of the
experimental setup (left). Mean Raman spectra and standard deviations of healthy and tumour tissue confirmed by
histopathology (right). Cancerous and healthy tissue show spectral differences associated with water, lipid and
protein content. Adapted from Figures 1 and 3a of "High wavenumber Raman spectroscopy for intraoperative assessment of
breast tumour margins", Analyst 148 (2023), by Jennifer Haskell et al., licensed under CC BY 4.0.
Using high-wavenumber Raman spectroscopy, where the Raman-scattered photons were detected in the NIR-II region, the
team investigated freshly excised human breast tissue. The technique enabled rapid differentiation between healthy and
cancerous tissue based on differences in water, lipid, and protein content. The analysis showed good agreement with
conventional histopathology results.
For the Raman characterisation, the researchers used a homebuilt handheld probe coupled to a spectrometer equipped
with an Oxford Instruments iDus InGaAs camera. The detector's high sensitivity was crucial for detecting the
high-wavenumber Raman signals in the NIR-II range from the tissue fast enough for rapid molecular classification.
The work demonstrates how Raman spectroscopy can provide clinically relevant information from intrinsic tissue
biomarkers. The approach has potential as an intraoperative tool for guiding surgical decision-making for precise
cancer removal and tissue conservation.
Original publication: Jennifer Haskell, Thomas Hubbard, Claire Murray, Benjamin Gardner, Charlotte
Ives, Douglas Ferguson, Nick Stone. High wavenumber Raman spectroscopy for intraoperative assessment of breast tumour
margins. Analyst 148 (18): 4373–4385 (2023). https://doi.org/10.1039/d3an00574g
Experimental Considerations for Selecting SWIR Spectroscopy Solutions
Different SWIR spectroscopy applications place different demands on instrumentation. Some experiments focus on
detecting extremely weak fluorescence, photoluminescence or Raman signals, where maximising sensitivity and minimising
noise are critical. Other workflows require high-throughput measurements, rapid acquisition of dynamic processes, or
collection of spatially resolved spectral information. Choosing the most suitable instrumentation therefore depends
not only on wavelength range, but also on the type of information required from the measurement.
The applications highlighted above ranged from biomarker sensing to tumour diagnostics, but the studies shared the
requirement of detecting optical signals in the NIR-II region with high sensitivity and spectral resolution for
revealing the relevant biological information. They relied on Oxford Instruments' iDus InGaAs cameras, which
provide sensitive detection across the NIR-II/SWIR region for low-light spectroscopy applications. Their low dark
current during long integrations enables detection of weak signals in fluorescence and Raman spectroscopy experiments.
Some research questions benefit from adding spatial or temporal information to spectroscopic measurements. Approaches
such as hyperspectral imaging, multitrack spectroscopy, and back focal plane imaging can reveal how molecular
signatures vary across cells, tissues or materials. Rapid acquisition rates are valuable for studying dynamic
biological processes and for high-throughput screening. Oxford Instruments' C-RED 2 for spectroscopy complements
traditional spectroscopic detectors by combining SWIR sensitivity with high frame rates and a two-dimensional sensor
format. This allows a single detector to support both spectroscopy and imaging experiments, and enables fast,
spatially resolved measurements.
A high-performance spectroscopic system requires not only a sensitive detector, but also a high-quality spectrograph.
Oxford Instruments' Shamrock and Kymera spectrographs provide high-throughput configurable platforms for
photoluminescence, Raman, absorption and emission spectroscopy. Their modular architecture allows researchers to
combine complementary diagnostic modalities within a single system and configure measurements across a broad
wavelength range spanning the UV, visible, NIR and SWIR regions. Depending on experimental requirements, researchers
can optimise the trade-off between spectral resolution and wavelength coverage for their individual applications.
Together, Oxford Instruments detectors and spectrographs support a wide range of SWIR spectroscopy applications.
Selecting the appropriate detector and spectrograph combination helps researchers tailor their instrument for the
challenge of their experiments, and obtain comprehensive information from their biological samples and functionalised
materials.
Conclusion
SWIR spectroscopy provides researchers with powerful tools for characterising functionalised molecules, biomarkers,
and biosensors. The examples presented in this article demonstrate how techniques operating in the NIR-II/SWIR region
can address different challenges, from detecting disease-associated biomolecules and understanding biosensor
mechanisms, to identifying cancerous tissue through intrinsic biomarkers. Selecting the appropriate combination of
detector and spectrograph for the respective experimental requirements is crucial for obtaining deep insight into
molecular structure, function, and biological behaviour. As new biomarkers, biosensors, and imaging agents continue to
emerge, SWIR spectroscopy will play an important role in their development, validation, and translation toward
biomedical and clinical applications.
References
[1] Merav Antman-Passig, Eitan Wong, Georgia R. Frost, Christian Cupo, Janki Shah, Albert Agustinus,
Ziyu Chen, Chiara Mancinelli, Maikel Kamel, Thomas Li, Lauren A. Jonas, Yue-Ming Li, Daniel A. Heller. Optical
Nanosensor for Intracellular and Intracranial Detection of Amyloid-Beta. ACS Nano 16 (5): 7269–7283 (2022).
https://doi.org/10.1021/acsnano.2c00054
[2] Nalige, S.S., Galonska, P., Kelich, P. et al. Fluorescence changes in carbon nanotube sensors
correlate with THz absorption of hydration. Nat. Commun. 15, 6770 (2024). https://doi.org/10.1038/s41467-024-50968-9
[3] Jennifer Haskell, Thomas Hubbard, Claire Murray, Benjamin Gardner, Charlotte Ives, Douglas
Ferguson, Nick Stone. High wavenumber Raman spectroscopy for intraoperative assessment of breast tumour margins.
Analyst 148 (18): 4373–4385 (2023). https://doi.org/10.1039/d3an00574g