Introduction
Accurate structural elucidation is essential across all areas of chemical research and manufacturing, where
confirming the identity, purity, and integrity of ingredients underpins product quality and performance. One example
where this is especially critical is the pharmaceutical industry, as component identity and purity directly influence
drug efficacy and patient safety.
Nuclear magnetic resonance (NMR) spectroscopy is a particularly powerful technique for this purpose. Unlike many
other analytical methods, NMR is non-destructive and provides detailed information about chemical structure, enabling
confident confirmation of known molecules as well as elucidation of unknown compounds. The combination of different
pulse sequences allows analysts to uncover complete molecular frameworks, making NMR an indispensable tool in modern
chemical development and quality control.
This application note demonstrates how to determine the full structure of a small-molecule pharmaceutical compound,
here Ibuprofen, using the Oxford Instruments X-Pulse 90 MHz Broadband Benchtop NMR Spectrometer. It
presents a detailed step-by-step workflow based on a series of one- and two-dimensional NMR spectra and shows how the
spectral information corresponds to the structural features of the molecule.
Sample - Ibuprofen
For this study, Ibuprofen1 was selected as a model compound. Like most small organic molecules, Ibuprofen
is well suited for the analysis by benchtop NMR spectroscopy due to its low molecular weight, good solubility, and
clear distinguishable proton and carbon environments.
Ibuprofen, 2-(4-(2-methylpropyl)phenyl)propanoic acid, is an anti-inflammatory drug commonly used to treat pain,
fever, and inflammation. First discovered in 1961 by Dr Stewart Adams and Dr John Nicholson, it is now included on the
World Health Organisation's List of Essential Medicines and is available globally without prescription.
Figure 1 shows the molecular structure of Ibuprofen. Eight unique proton chemical environments (1,
3, 4, 6, 7, 9 - 11), and the ten unique carbon environments
(2 - 11) can be clearly identified.
1~0.4 mol/ℓ solution in DMSO-d6
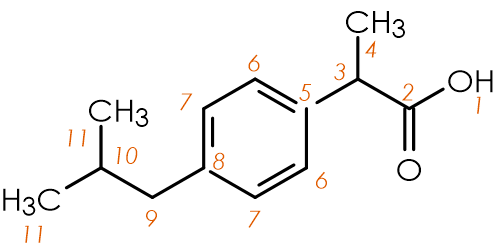
Figure 1 Molecular Structure of Ibuprofen. The numbers (1-11) indicate the unique proton
and carbon environments.
Structural Elucidation
In this application note, we obtained and analysed a series of one- and two-dimensional NMR spectra of Ibuprofen and
illustrate how each spectrum contributes unique pieces of structural information. Together, these routinely used pulse
sequences form a practical workflow for confirming and elucidating the complete structure of small organic molecules.
One-dimensional NMR Spectra
Simple one-dimensional NMR spectroscopy entails the excitation of nuclei of a single isotope to get information about
those atoms only. This produces spectra with signal intensity against frequency. The chemical shift (δ) is plotted on
the horizontal axis, in ppm (parts per million). The plotting of chemical shift in ppm rather than Hertz (Hz) ensures
comparability between data measured by different spectrometers.
Proton (Hydrogen-1) NMR
The first NMR spectrum obtained of most known or unknown samples, is usually a simple proton (hydrogen-1) NMR
spectrum, which for most samples can be obtained in under 5 minutes. The 1H NMR spectrum of Ibuprofen is
shown in figure 2.
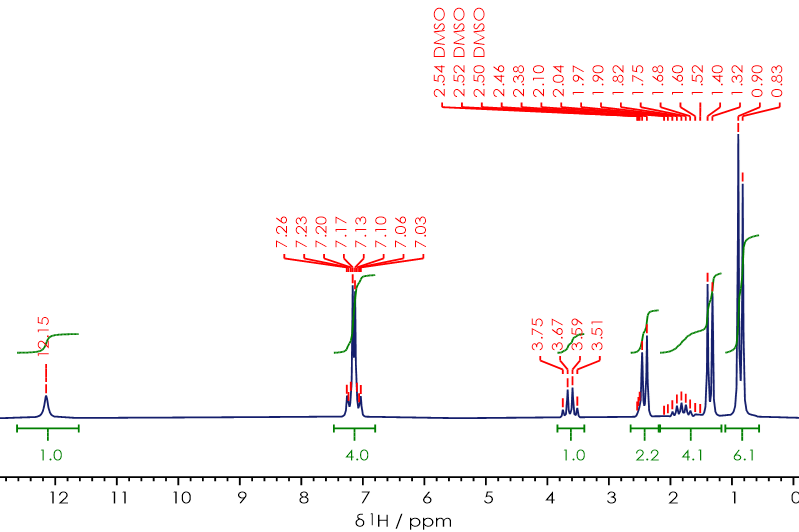
Figure 2 1H NMR spectrum of Ibuprofen in DMSO-d6.
Signals in an NMR spectrum comprise one or more individual peaks, for example while the signal at δH 12.2 ppm is a
single peak, the signal centred at δH 3.63 ppm comprises four peaks (and would commonly be described as a quartet).
There are three major features that should be considered for each signal in a 1H NMR spectrum:
- the chemical shift, δH, of the signal in the spectrum, which corresponds to the local chemical environment of the
nuclei giving rise to the signal;
- the (integrated) area of each signal, which corresponds to the number of nuclei associated with each signal. The
integral value shown in green below each signal in figure 2;
- the multiplicity of the signal, which comprises the number of peaks in the signal, their relative intensities, and
the separation between the peaks. It also provides information on other nearby NMR-active nuclei.
By initially considering only the chemical shifts and integrated areas of the signals, an initial assignment can be
made as follows:
- one carboxylic acid proton;
- four aromatic protons;
- five signals, arising from thirteen aliphatic protons.
Since there is only a single carboxylic acid proton in Ibuprofen (see figure 1, position
1) that can be assigned to the signal at δH 12.2 ppm. The signal for four aromatic protons centred around δH
7.15 ppm, can be assigned to protons (positions 6 & 7).2 To further assign
the five alkyl signals, their multiplicity should be considered alongside their integrations and chemical shifts.
In simple cases, the number of peaks that make up an 1H NMR signal correlate to the number of protons
bound to adjacent carbon atoms, with one more peak than the number of carbon atoms. It is therefore possible to
identify the following facts for the remaining unassigned signals.
The signal at δH 3.6 ppm is made up of four peaks, and integrates as a single proton, implying a CH group adjacent to
a CH3 group, the only proton in Ibuprofen consistent with this is the one at position 3.
There are three signals at δH 2.4, 1.4 and 0.9 ppm, each made up of two peaks (a doublet) implying they're
immediately adjacent to a single CH group. The signal at δH 0.9 ppm integrates as six protons, suggesting two
CH3 groups, with the two methyl groups (position 11), as the only possible protons in Ibuprofen it
could be. The signal at δH 2.4 ppm integrates as approximately two protons,3 thereby corresponding to a
CH2 bound to a CH, and consistent with environment 9 in Ibuprofen. The remaining doublet
at δH 1.4 ppm corresponds to three protons, hence as a CH3 bound to CH, and therefore environment
3 in Ibuprofen.
By a process of elimination, the multiplet at δH 1.8 ppm, can be assigned to the CH group at position
10, which is bound to two CH3 groups and one CH2 explaining the more complex coupling
pattern.
While unnecessary to assign the proton NMR spectrum in this case, there's one more piece of information which may
be obtained from a 1H NMR spectrum to aid in the assignment of signals. When couplings occur between
nuclei, resulting in observation of multiplets in the NMR spectrum, the magnitude of that coupling can be measured (in
Hz) from the separation of the peaks in the multiplet. Since the coupling is a constant, the same value will be
measured whichever signal from a pair is chosen. This can be applied to pair up signals in the NMR spectrum that are
directly coupled. For example, the quartet at δH 3.6 ppm, which has been assigned as environment 3,
has a coupling constant, 3JHH of 7.1 Hz, while the doublets at δH 2.4, 1.4, and 0.9
ppm, have coupling constants of 3JHH 7.0, 7.1, and 6.5 Hz respectively, confirming that
the signal at δH 3.6 ppm, is coupled with that at δH 1.4 ppm (which has already been assigned as environment
4).4 This potentially time-consuming process of measuring and pairing couplings to aid assignment
can be avoided with the use of two-dimensional spectra, as shown later for the 1H-1H COSY
spectrum.
2 The multiplicity of this signal is consistent with a para substituted aromatic ring, however an
explanation of this is beyond the scope of this Application Note.
3 The signal overlaps with the signal for the protio-DMSO impurity, and therefore has a higher
integral that would be the case for just a CH2 group.
4 The magnitude of the J-coupling can also provide information about the relative positions of
the nuclei; however there are no suitable examples in Ibuprofen, putting this beyond the scope of this Application
Note.
Carbon-13 NMR
While Hydrogen-1 (proton) is a high gyromagnetic ratio nucleus with near 100% natural abundance, making it the
'best' nuclei for NMR spectroscopy, the situation for carbon is more complex. The most abundant isotope of
carbon, carbon-12, is NMR inactive. Instead, carbon NMR spectra are measured using carbon-13, this has only 1.1%
natural abundance along with a lower gyromagnetic ratio than proton. Therefore, carbon-13 is 1/5870th the receptivity
of the proton; hence requiring higher sample concentrations and longer measurement times.
The carbon-13 NMR spectrum is shown in figure 3, the spectrum appears simpler than the proton spectrum with
all signals appearing as a single sharp peak. This is because all carbon-proton couplings have been removed by
applying proton-decoupling. This spectrum is referred to as a proton-decoupled carbon-13 NMR spectrum, simplified to
13C{1H} NMR spectrum.5
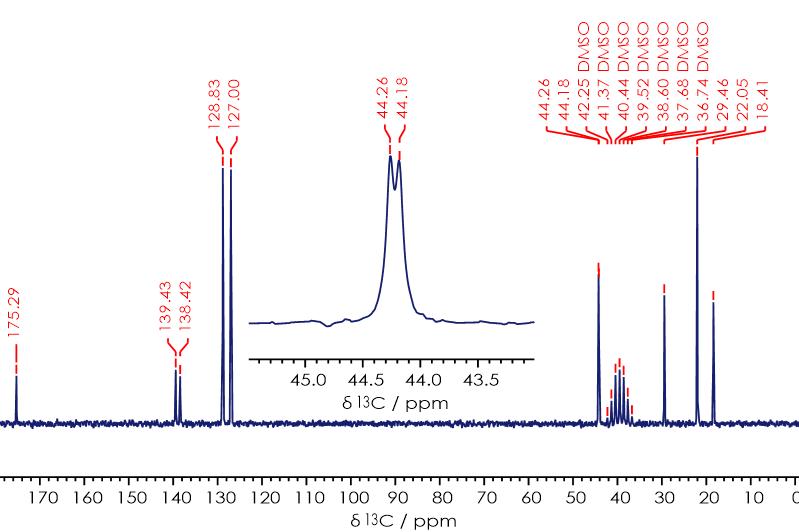
Figure 3 13C{1H} NMR spectrum of Ibuprofen in DMSO-d6.
There are ten chemically unique carbon environments in Ibuprofen, which can all be observed in the carbon-13 NMR
spectrum of Ibuprofen.6 Unlike the proton NMR spectrum, a proton-decoupled carbon-13 NMR spectrum is an
exception to the rule that integration of peaks/signals directly corresponds to the number of nuclei giving rise to
that signal.7 However, there is still some information which can be inferred from the intensity of signals
in a 13C{1H} NMR spectrum.
In general signals of carbon atoms not directly bound to any protons (quaternary carbons), are considerably
less intense than if the carbon atom is directly bound to one or more protons. This can be observed for the signals at
δC 175.3, 139.4, and 138.4 ppm, along with the signal (a 1:3:6:7:6:3:1 septet) arising for the deuterated
dimethylsulfoxide solvent. By considering the chemical shift of these carbon signals, it's possible to assign the
signal at δC 175.3 ppm as a carbonyl group, and hence to the carboxylic acid carbon (position 2). While the
signals at δC 139.4 and 138.4 ppm are consistent with aromatic carbons, and therefore the quaternary carbons
(positions 5 & 8).
The two considerably more intense signals in the aromatic region, at δC 128.8 and 127.0 ppm, can therefore be
assigned as the aromatic CH carbons (positions 6 & 7).
The remaining five signals in the carbon-13 NMR spectrum, are all consistent with alkyl, CHx
carbons, with those at a lower chemical shift likely to correspond with the terminal methyl, CH3 groups. A
complete assignment of these signals requires additional information which cannot be obtained from a simple
one-dimensional 13C{1H} NMR spectrum.
5 Carbon-carbon couplings are generally not observed, due to the low
natural abundance of carbon-13, and hence the weak signals that would result.
6 At lower frequencies, the two peaks at δC 44.2 ppm will
generally overlap and appear as a single peak.
7 It is possible to obtain carbon-13 spectra that can be integrated,
however that requires non-standard sequences, and even longer experiment durations.
Two-dimensional NMR Spectra
So far, only simple one-dimensional NMR spectra have been considered. However, one of the great strengths of NMR
spectroscopy, is the wide range of different pulse sequences available, and the different spectra which may be
obtained. One major group of sequences are those that give two-dimensional correlation spectra. In these cases,
cross-peaks are observed corresponding to interactions (such as through J-couplings) between signals observed
in the corresponding one-dimensional spectra. The following examples demonstrate how the introduction of a second
dimension can resolve complications due to overlap, significantly simplify the assignment process, and result in rapid
identification of complex molecules.
1H-1H Correlation Spectroscopy
The first two-dimensional spectrum to be considered is the proton-proton Correlation
Spectroscopy (COSY) spectrum, which is shown in figure 4 for Ibuprofen.
Note that on the x and y axis, the simple proton spectrum discussed previously is displayed. The
actual two-dimensional spectrum consists of cross-peaks shown in red in figure 4.
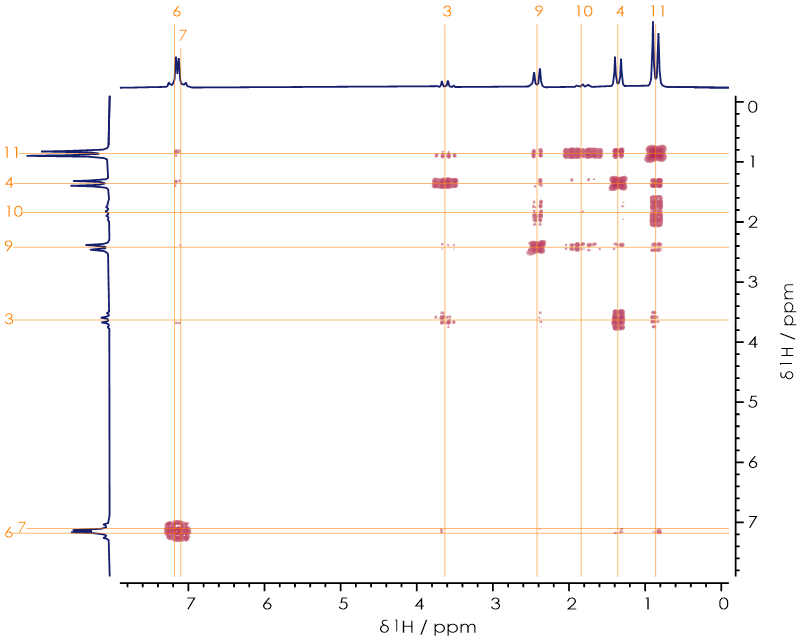
Figure 4 1H-1H gradient-selective Correlation
Spectroscopy NMR spectrum of Ibuprofen in DMSO-d6.
As a homonuclear correlation spectrum, a COSY is symmetric along the diagonal, with off-diagonal cross-peaks present
when signals directly couple. In general, cross-peaks will be observed in the COSY, for signal pairs where
J-coupling is observed in the one-dimensional spectrum.
In the case of Ibuprofen, cross-peaks are observed in the COSY spectrum for environment 4 -CH3
and environment 3 -CH; additionally cross peaks are observed between the three signals of
environment 9 -CH2, environment 10 -CH, and environment 11
-CH3. This is also an example of where COSY cross peaks can be observed when the J-coupling is not
observed in the one-dimensional spectrum, as in the case for the four-bond interaction between environment 9
-CH2 and environment 11-CH3.
1H-13C Correlation Spectra
In addition to proton-proton correlation experiments like the COSY, pulse sequences which allow for the observation
of proton-carbon correlations also aid the assignment process. Two of the most commonly used are the
Heteronuclear Single Quantum Coherence with
Multiplicity Editing (HSQC-ME) sequence which allow for the observation of single
bond proton-carbon correlations, and the Heteronuclear Multiple
Bond Correlation (HMBC) sequence which allows for the observation of multiple bond
proton-carbon correlations.
The 1H-13C HSQC-ME and 1H-13C HMBC spectra (figures 5 &
6 respectively) both show the proton spectrum in the horizontal dimension, while the carbon spectrum is
displayed in the vertical dimension. The cross peaks in figure 5 for the HSQC-ME spectrum of Ibuprofen
correspond to the single bond proton-carbon correlations. This spectrum was also obtained multiplicity edited, which
provides information on the multiplicity of the CHx environments. With CH and CH3 giving
cross-peaks with positive phase (red in figure 5), and CH2 giving cross-peaks with negative phase
(blue in figure 5).
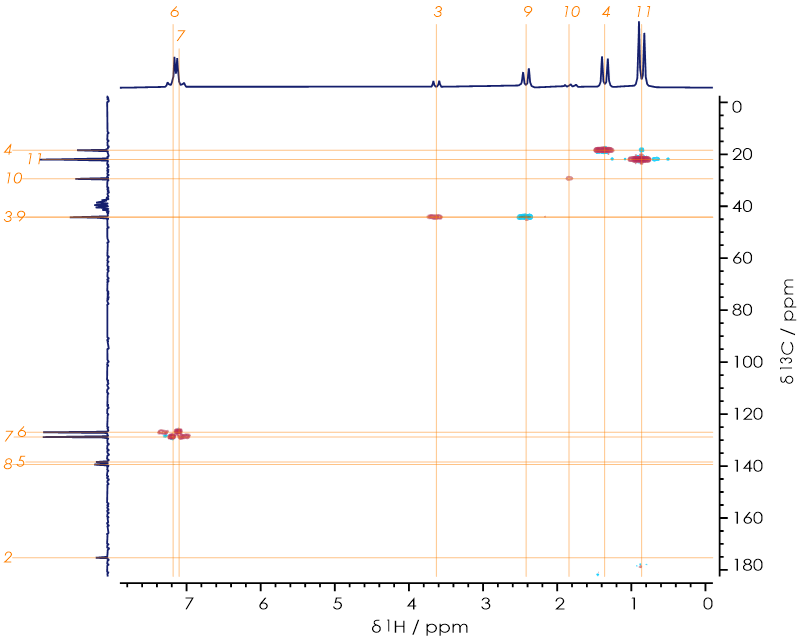
Figure 5 1H-13C gradient-selective Heteronuclear
Single-Quantum Correlation with multiplicity editing NMR spectrum
of Ibuprofen in DMSO-d6.
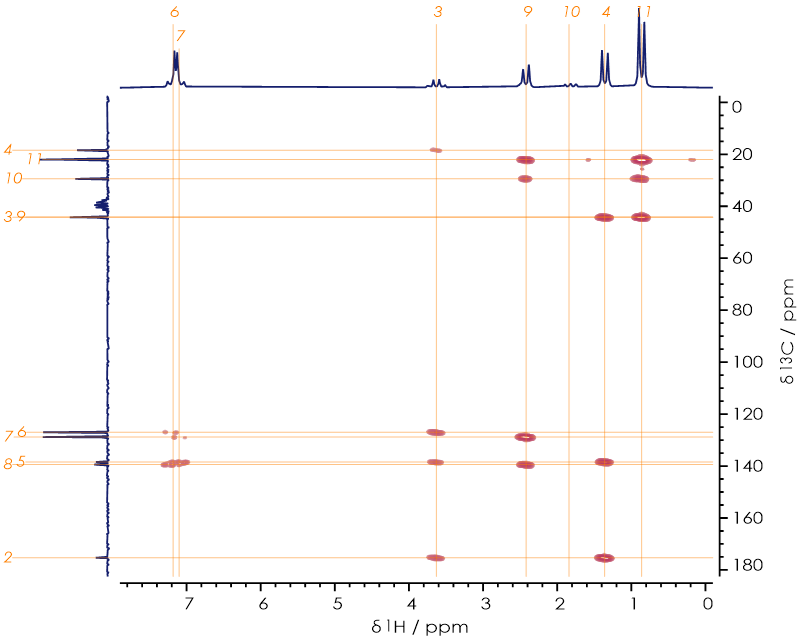
Figure 6 1H-13C gradient-selective Heteronuclear
Multiple-Bond Correlation NMR spectrum of Ibuprofen in
DMSO-d6.
The 1H-13C HMBC spectrum of Ibuprofen is shown in figure 6, with the observed
cross-peaks corresponding to two or three bond proton-carbon correlations. The HMBC spectrum allows for the full
structural assignment / elucidation for Ibuprofen to be completed.
For example, the signal at δH 3.6 ppm for position 3 -CH, correlates with an aromatic CH at δC
127.0 ppm and a quaternary aromatic carbon at δC 138.4 ppm, identifying the source of those signals as
environments 6 and 5 respectively. By systematically applying this for all the signals, the
carbon-connectivity can be deduced, and the full spectrum assigned / structure elucidated.
Additional Two-dimensional Correlation Spectra
The COSY, HSQC and HMBC are not the only two-dimensional pulse sequences available on the X-Pulse
which are useful for the assignment of NMR spectra, and elucidation of chemical compounds. The Total
Correlation Spectroscopy (TOCSY) sequence allows for the
observation of not only the direct proton-proton couplings observed in the COSY, but also indirect proton-proton
couplings through the spin system.8
While the Nuclear Overhauser Enhancement
Spectroscopy (NOESY) shows cross-peaks arising from a through-space
interaction,9 and allows for the three-dimensional structure of molecules to be determined.
8 See our Application Note “1H-1H COSY & TOCSY two-dimensional NMR spectroscopy”
9 Rather than the through-bond interactions observed by COSY, TOCSY, HSQC & HMBC.
Ibuprofen Spectral Assignments
By analysing all these spectra, it is possible to fully assign the signals in the one-dimensional spectra. The
complete assignment of the proton and carbon-13 NMR spectra of Ibuprofen are detailed as follows.
δH (90.52 MHz, 37°C, DMSO-d6): 12.15 (1H, s, 1-OH), 7.3 – 6.9 (4H, m, 6,7-C6H4), 3.63
(1H, q, 3JHH 7.1, 3-CH), 2.42 (2H, d, 3JHH
7.0, 9-CH2), 1.82 (1H, m, 3JHH 7.0,
3JHH 6.5, 10-CH), 1.36 (3H, d, 3JHH 7.1,
4-CH3), 0.86 (6H, d, 3JHH 6.5, 11-CH3).
δC (22.76 MHz, 37°C, DMSO-d6): 175.29 (1C, s, 2-C=O), 139.43 (1C, s, 8-CH), 138.42 (1C, s, 5-CH), 128.83
(2C, s, 7-CH), 127.00 (2C, s, 6-CH), 44.26 (1C, s, 3-CH), 44.18 (1C, s, 9-CH2), 29.46 (1C, s, 10-CH), 22.05
(2C, s, 11-CH3), 18.41 (1C, s, 4-CH3).
Summary
In this application note, a series of one and two-dimensional proton and carbon-13 NMR spectra were used to
demonstrate the complete structural assignment of Ibuprofen. The spectra obtained on the Oxford Instruments
X-Pulse 90 MHz Broadband Benchtop NMR Spectrometer provided the necessary information to identify all the
proton and carbon environments, establish their connectivity, and hence confirm the identity of the compound. This
workflow illustrates how benchtop NMR spectroscopy can support reliable structural elucidation of small organic
molecules, including those commonly encountered in pharmaceutical research and quality assessment.

