Summary
Steels are used for a wide range of purposes with their properties optimised for the particular application they have been designed for. The presence of non-metallic inclusions in steel can have a significant effect on that steel's properties and consequently, analysing and documenting non-metallic inclusions according to nationally or internationally agreed published standards is crucial both for assessing and communicating the quality of a steel. This application note demonstrates how AZtecSteel, an industry leading, dedicated particle analysis solution for the analysis of non-metallic inclusions can characterise inclusions in different types of steels to the requirements of multiple international standards.
Introduction
The aim of steel manufacturing is to produce steels of a variety of different grades for a variety of different applications with major examples being in the automotive, shipbuilding and construction industries. It is of critical importance both from safety/performance and cost perspectives that the steel is of a suitable specification for the intended use and as such, the cleanliness level of steels is a topic of great interest. Cleanliness is determined by the composition, size, number and distribution of non-metallic inclusions in the steel. These inclusions can have a significant influence on the mechanical properties of a steel e.g. notch sensitivity, creep and fatigue properties. In general, large non-metallic inclusions of any type are undesirable in all steels, while very fine inclusions can be either beneficial or harmful. Given that the assessment of a steel often takes place in a production environment, fast and accurate evaluation methods are key in determining their influence on the quality of steel.
There are a number of methods used to describe inclusion type and count – developed by various national and international standards bodies including the following: ASTM, DIN, ISO, ENV, GBT and SIS. These methods often report on steel cleanliness in terms of severity levels and in some cases were originally developed using light optical microscopy (LOM) (with inclusions assigned to a category based on morphology based on reference images without direct measurements of composition). This process requires time and expertise, and limits the minimum inclusion size that can be detected as well as lacking the additional information source provided by chemical data. As such, it is not the optimal approach for modern steels which often have fewer and finer non-metallic inclusions and compound inclusions which may consist of multiple inclusion type (e.g. sulfides + silicates). In addition, the lack of compositional information in LOM can mean that some inclusions identified with this approach can fall into multiple categories causing misinterpretation.
Given the disadvantages of LOM discussed above, the analysis of non-metallic inclusions is best addressed with a scanning electron microscope (SEM) equipped with Energy Dispersive X-ray spectroscopy (EDS) controlled by dedicated particle analysis software. The use of SEM + EDS adds precision as morphology is directly measured from electron images (at the micro or nano-scale) and chemical information is directly measured to distinguish between different inclusions types as opposed to being inferred from shape. In addition, SEM/EDS data can be collected under full automation and does not require the presence of the operator during acquisition. The automated approach ensures repeatability and accuracy and, as a result, eliminates the subjectivity that can be introduced by the human eye in LOM.
AZtecSteel is an automated solution developed specifically for the analysis and reporting of cleanliness ratings of steels, using EDS in SEM, providing fast, accurate and reliable data.
The following describes the use of AZtecSteel for the classification and reporting of automatically collected data on steel inclusions to the requirements of published national and international standards.
SEM-based Inclusion Analysis
AZtecSteel combines with large area Ultim® Max or Xplore silicon drift detectors (SDDs) which enable high resolution EDS spectra to be acquired at very high-count rates. This means that high quality EDS data can be acquired with short acquisition times, enabling the highest levels of throughput while maintaining reliable classification of micro to nano-sized inclusions. All acquired data is automatically processed with AZtec's Tru-Q™ algorithms to ensure accurate quantification at these speeds.
AZtecSteel is a powerful and flexible particle analysis platform for SEM which can characterise non-metallic inclusions for both automated and manual investigation. It is able to perform both morphology only or full compositional and morphological analysis. This process can be completed at inclusion EDS acquisition rates of in excess of 120,000 inclusions per hour for full morphology and compositional screening.
AZtecSteel consists of a customised recipe in the AZtecFeature particle analysis platform and Inclusion Classifier. AZtecFeature is used to detect, measure and analyse the inclusions in the steel and Inclusion Classifier processes and reports the resulting data set to the published standard methods.
Sample and Data Acquisition
A sample from an SCM420 alloy steel was investigated. SCM420 is a general structural steel and is widely used for components which need high wear resistance, such as gears, shafts, high-pressure pipes and fasteners. Inclusions in SCM420 steel must be strictly controlled in terms of both their type and morphology because they can act as channels for the formation of microcracks, which can result in the brittle fracture of the material.
The sample was cut and mechanically polished using standard metallographic techniques. The specimen was examined with AZtecSteel and an Xplore 30 silicon drift detector (SDD) using a Tabletop SEM. EDS data was collected at 15kV. Automated large area analysis was used to collect data from across the surface of the sample to ensure statistical significance.
(a)
(b)
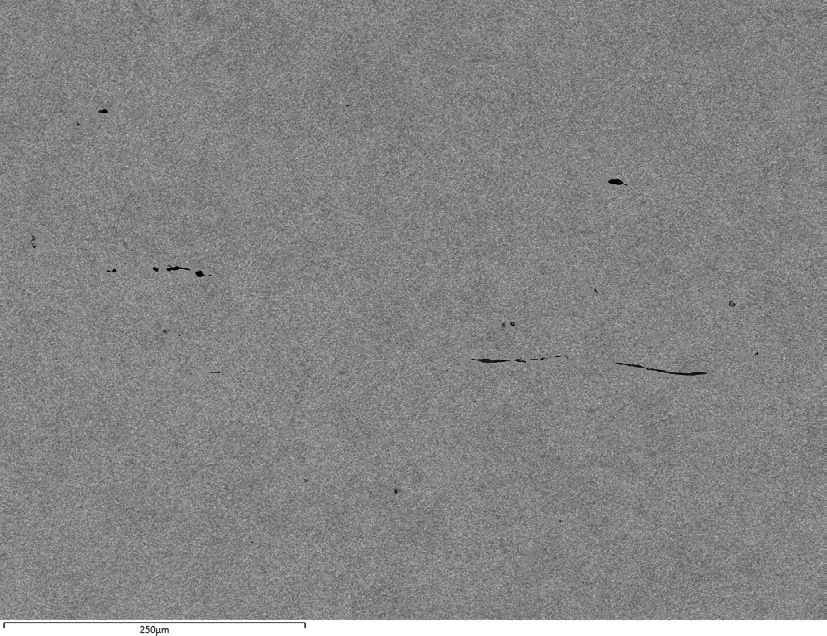
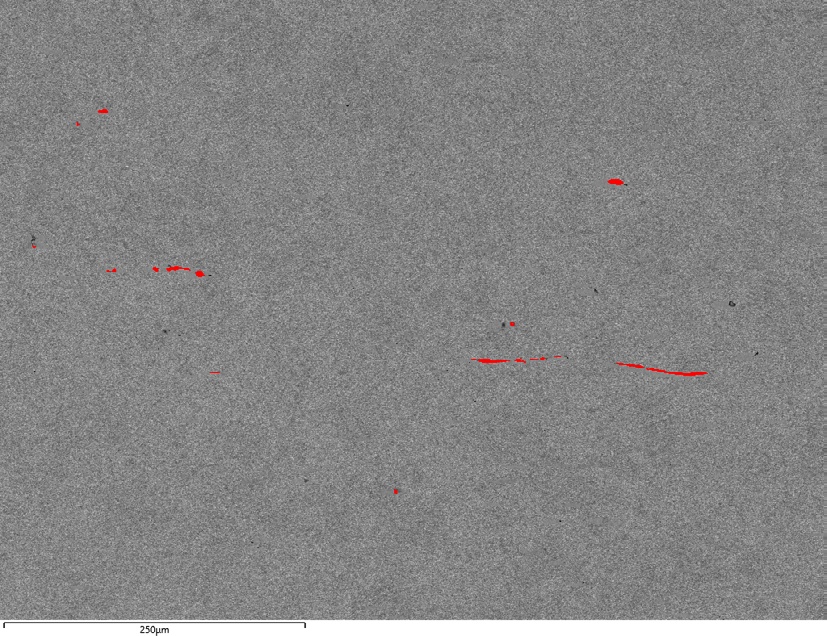
Fig 1. (a) BSE image showing inclusions in SCM420 steel; (b) Inclusions are identified coloured by a single grey level threshold
Detecting Inclusions and EDS Analysis
The sample was imaged using the SEM's backscattered electron (BSE) detector. Contrast in BSE images is related to the density of the phase, making BSE imaging ideal for finding inclusions as the majority of non-metallic particles are made of lighter elements (i.e. Al, Ti, Mn, Si, S, O) than Fe and as such, they appear darker than the Fe matrix in the BSE image. In such cases, the inclusions are identified and separated from the steel matrix by means of a single grey level threshold.
The threshold information was used to automatically determine where EDS measurements should be taken. The morphology of all inclusions falling within the threshold(s) was measured automatically and combined with compositional data from the subsequent EDS analysis. Fig. 2 shows typical spectra acquired from oxide and MnS inclusions in the sample at 15kV.
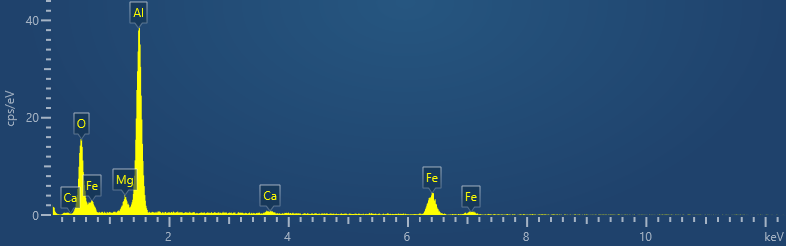
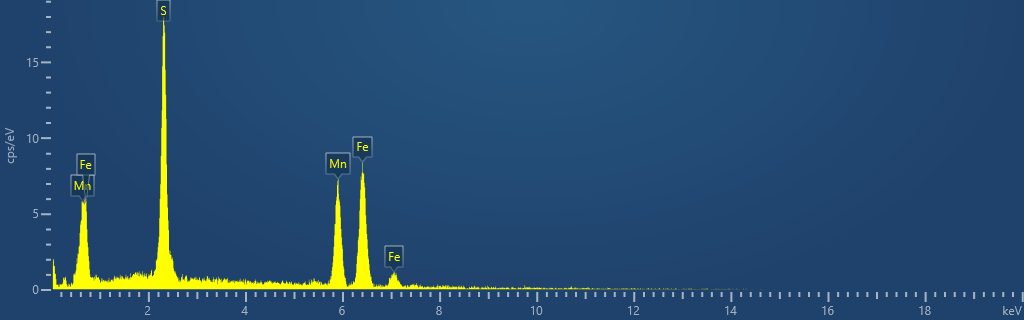
Fig 2. Typical spectra acquired from oxide and MnS inclusions in the sample at 15kV
Automated Large Area Analysis
The analysis shown above can easily be extended to cover a larger area of the sample by automating the analysis to cover multiple fields of view and reporting the combined data as a single dataset. Some standards have the requirement of analysing 160mm² and this automation allows this requirement to be met. The data shown in this application note was obtained over a total rectangular area of 178mm². 3850 particles were detected and analysed in real time. Over 40,000 x-ray counts were acquired from each inclusion.
As soon as the EDS data was acquired, it was quantified, and the inclusions were classified using a dedicated steel cleanliness classification scheme. This gave a quick overview that inclusions in this sample are various oxides, sulfides, silicates and complex oxisulfides in spheroidal and stringer forms.
Fig. 3 shows a montaged image of the large area. Particles are coloured by their classification.
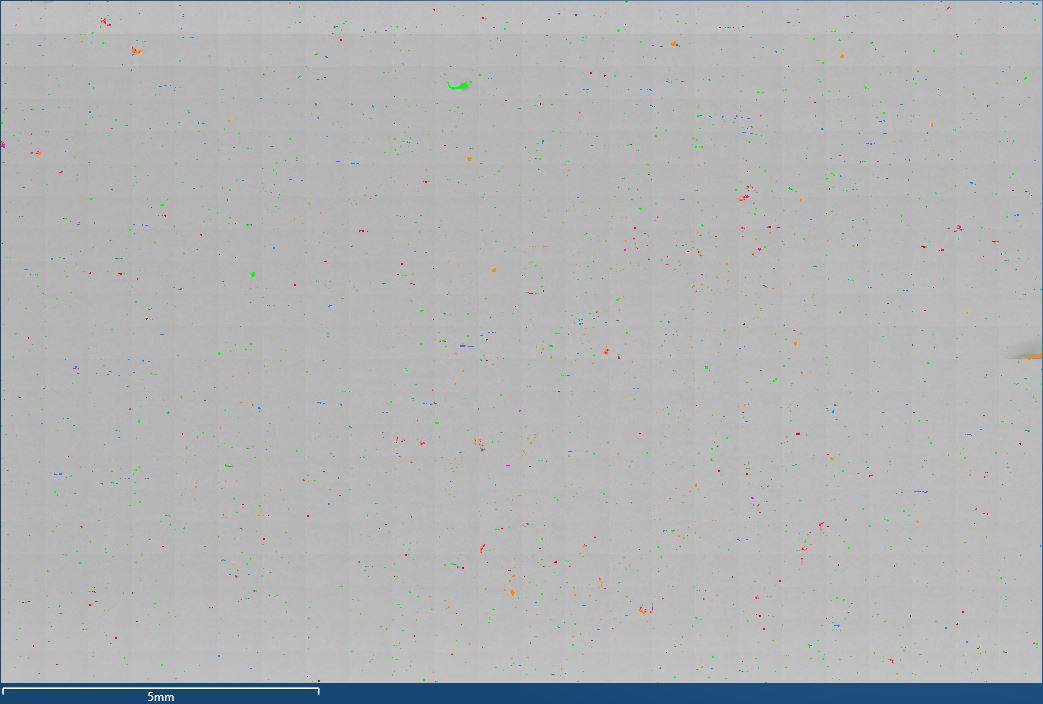
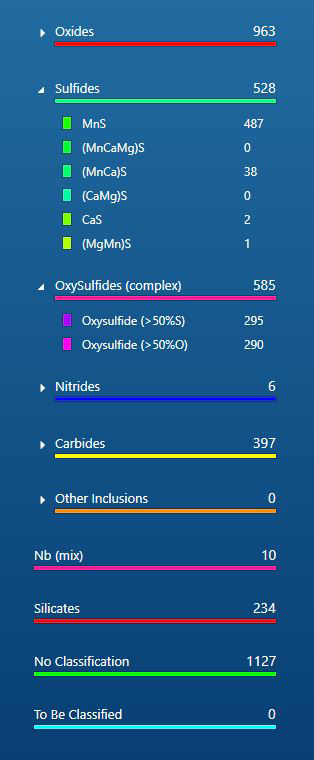
Fig 3. Montaged image of the large area showing detected particles.
Reporting to Published Standards
Inclusion Classifier then automatically analyses the resulting EDS and morphological data and rates the compliance of the inclusions to the required standard. It automatically processes the data in respect of removing debris (i.e. contamination and scratches); removing the matrix components from EDS data; generating fields according to the selected standard; determining inclusion types; performing stringer calculations; presenting the data according to the chosen standard and producing instant reports of the results.
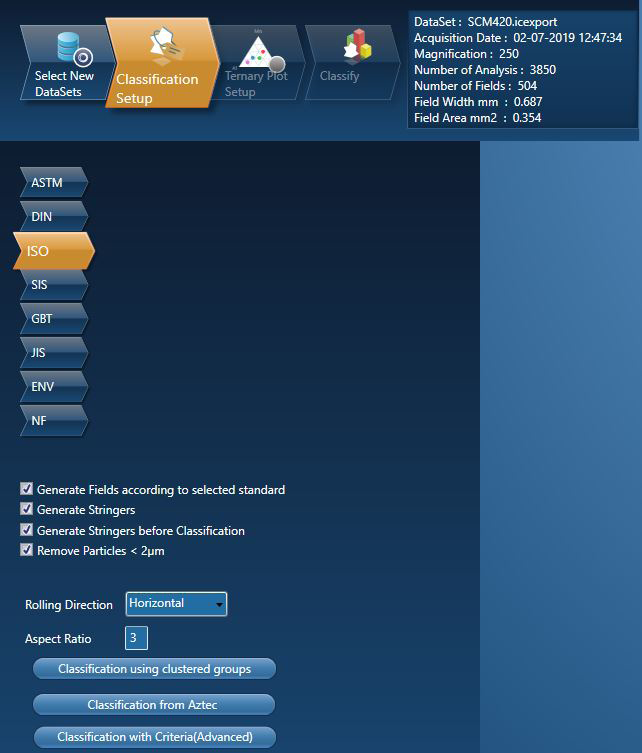
Fig 4. Inclusion Classifier interface of standard selection and classification setup
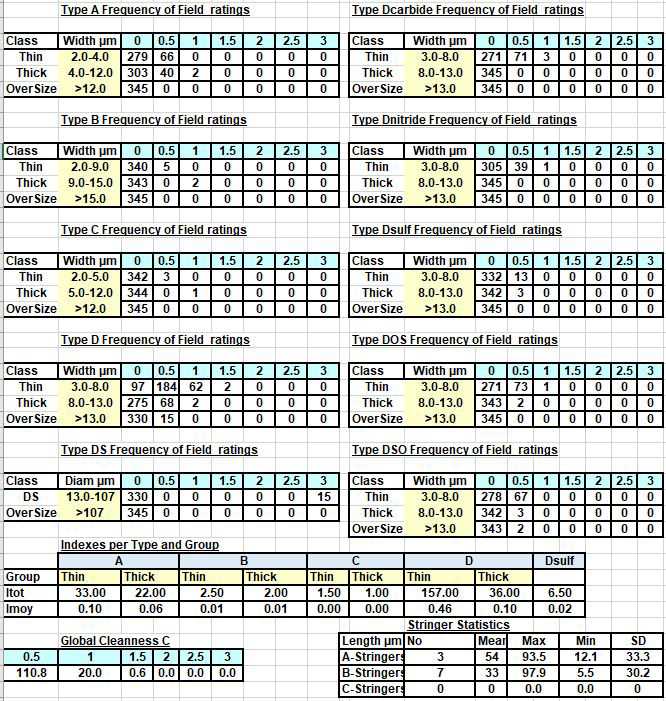
Fig 5. Severity ratings results as reported in Excel for ISO from the SCM420 steel sample.
Multiple datasets can be processed simultaneously for combined analysis.
Inclusion Classifier reports steel cleanliness in line with published standards including ASTM E2142, DIN 50602, ISO 4967, SS111116, GBT 30834, JIS G0555, NV 10247, NF A04-106 and Pirelli Method.
As shown in Fig. 4, it is easy to classify the same data set to more than one standard if required.
The results which are calculated will vary depending on the chosen standard — for ASTM E2142 severity ratings and stringer measurements will be calculated and for DIN 50602 K values will be determined. The results are generated in the format required for each individual standard, presented in Inclusion Classifier and exported in Microsoft Excel.
The following results from SCM420 steel are calculated for the ISO 4967 standard. The data shown in Fig. 5 includes severity ratings for the different inclusion types and a summary table giving statistics of the stringers.
The report also includes:
- An inclusion list which details morphology, composition and inclusion type for each inclusion.
- Statistics for each inclusion type — including a calculation of how many inclusions of each type are present in each field on average.
- Oversized inclusions. This includes the Feature ID, which corresponds to the particle number given in AZtecFeature so it is easy to identify these inclusions and relocate them under the SEM beam for further analysis. Also included in this table is the area size of the inclusion and the inclusion type.
- The summary data for A, B and C type stringers including the number of member inclusions in the stringer and the total area of the stringer.
- The inclusion overview shows the relationship between deformable and non-deformable inclusions in terms of the number of inclusions, their length and area.
Examples of these reports for ISO are shown in Fig. 6.
The results evaluate the cleanliness level of the steel which can be correlated to mechanical properties i.e. fatigue strength etc.
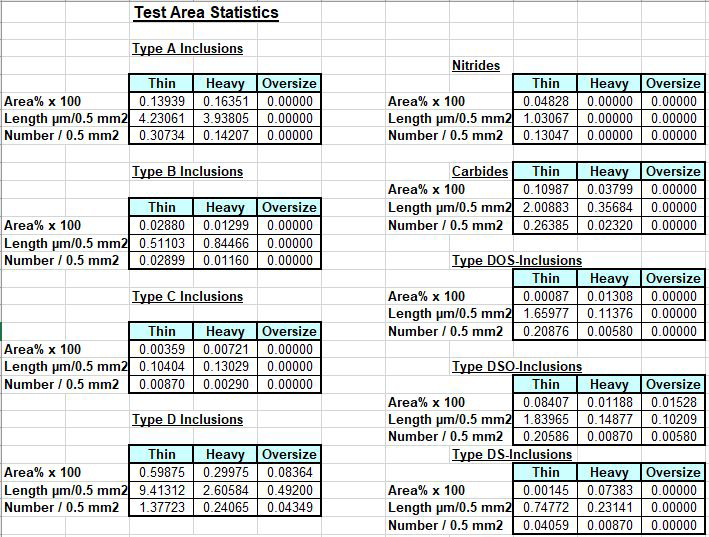
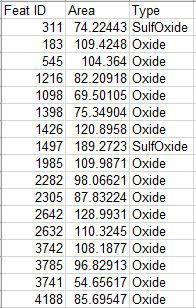
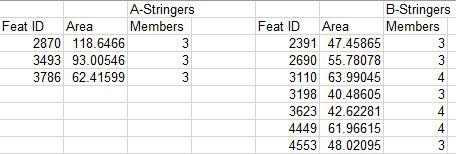
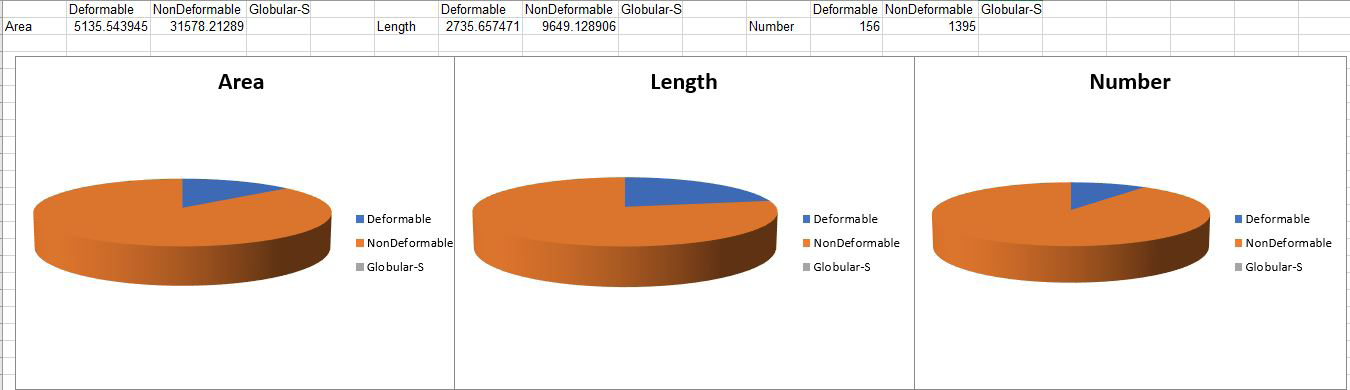
Fig 6. Example of (a) Statistics Summary Report; (b) Oversized Inclusions (c) Summary of Stringers; (d) Inclusion overview from SCM420 steel for ISO standard.
Conclusion
AZtecSteel offers a powerful automated solution for the finding and identification of steel inclusions. It is an ideal tool for analysing clean and ultra-clean steels. Data can be classified to any of nine published standard methods, giving results that comply to the selected standard. All of the data is reported in MS Excel®, presenting the data in an easily accessible format.

