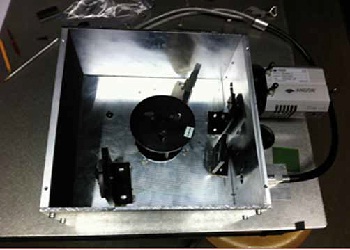
Fig.1: Experimental setup for absorbance measurements containing an optical fibre for illumination, an iDus InGaAs DU490A-1,7 detector and spectrometer.
In-vivo monitoring of glucose concentration in blood is a big challenge. We want to develop equipment for the diagnosis and therapy of diabetes patients in order to achieve an optimum metabolism control with frequent blood glucose measurements. Non-invasive and simple sensing of glucose is of increasing importance, since the number of diabetes patients is increasing and more than 70% are living in low and middle income countries.1
Some promising approaches involve investigations in the near infrared region (NIR). The effective penetration depth of light is 60 µm to 3 mm in biological tissue depending on illumination wavelength. For wavelengths between 1.2 – 2.5 µm glucose absorbance is most significant. Many groups focus their investigations on spectroscopy in this spectral region and on the Raman scattering response of glucose. In student projects we spend increasing attention on the spectral region from 0.8 – 1.4 µm, since the largest penetration depth is available within this ‘optical window’ for biological tissue. For lower wavelengths the absorption of deoxyhemoglobin, oxyhemoglobin2 and melanin becomes significant, while for larger wavelengths water absorption is of increasing impact.3 The advantage of the higher penetration depth was the crucial feature for the following investigations with the tradeoff of less significant glucose absorption.
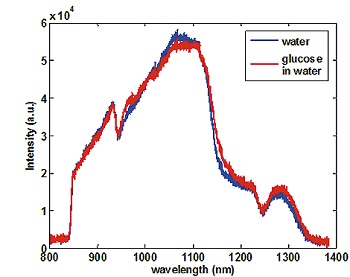
Fig. 2: Background corrected transmission data of distilled water and a high concentrated glucose solution for an exposure time of 10 ms.
We compared distilled water with glucose dissolved in water using a halogen illumination source, and an iDus DU490A-1,7 InGaAs detector from Andor Technology. The spectrometer, we designed by ourselves (fig.1) and achieved a spectral resolution of 0.33 nm. A phantom highly concentrated glucose solution was prepared4 c = 4.4 mol/l. The investigation volume was about 0.6 cm3.
The lattice was mounted on a rotational stage to detect separate spectral regions on the active area of the detector. Furthermore to avoid second order effects an 850 nm long pass filter was incorporated in the optical path. With an exposure time of 10 ms transmission data show just minor influence of glucose (Fig.2).
Analysis of the difference between water and 4.4 mol/l glucose solution spectra shows significant deviations (fig.3). Peaks in figure 3, marked by dotted lines and areas above the zero line can be attributed to volume-displacement effect, since higher glucose fraction causes a reduced amount of water. As a clear measure of glucose concentration, the area below the zero line between 1000 nm and 1100 nm can be explained. Here the transmission is higher for glucose in water than for water (arrow in fig.3).
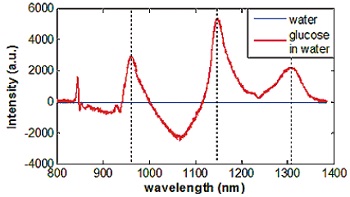
Fig.3: Spectral deviation of a water spectrum and a spectrum of 4.4 mol/l glucose solution. Dotted lines mark peaks indicating volume-displacement of water, while the arrow shows the significant contribution of glucose in the NIR region between 0. 8 µm and 1.4 µm.
In the spectral range of the 'optical window' of tissue where the penetration depth is up to 3 mm, an accurate analysis of the region between 1.0 µm and 1.1 µm can be used for an in-vivo monitoring of glucose concentration.
Literature
1. IDF, Diabetes Atlas, 4th edition, world health organisation WHO, update 15-3-2012.
2. Molar extinction coefficients of oxy and deoxyhemoglobin compiled by Scott Prahl. URL: http://omlc.ogi.edu/spectra/hemoglobin
3. G. M. Hale, and M. R. Querry, Optical constants of water in the 200 nm to 200 µm wavelength region, Appl. Opt., 12, 555-563, 1973.
4. In cooperation with Dr. Uwe Netz, Laser- and Medicine Technologie Berlin (LMTB).
Contact
Prof. Dr. Ingeborg Beckers
Beuth University of Applied Sciences
Seestr. 64
13347 Berlin
Phone: ++49-30-45043912
E-mail: beckers@beuth-hochschule.de

