Introduction
New and existing materials for lithium ion batteries are being studied extensively with the aim of increasing their storage capacity and lifetime. While the SEM is an important tool in the study of these materials, characterising the distribution of Li still remains one of the main challenges.
Detection of Li K X-rays from metallic Li with a windowless EDS detector was first shown by Oxford Instruments, Burgess et al. [1] and of Li compounds by Hovington et al. [2].
Here we show the latest progress towards characterising Li-ion battery materials with EDS in SEM by exploring how lithiation can be studied on graphite anodes with the Extreme detector and on lithium containing ceramics using a conventional detector.
Li Detection by EDS
Graphite anodes were measured using an Ultim® Extreme EDS detector. After charging, the graphite particles contain intercalated lithium between graphene layers. Lithium compounds also form on the surface as a solid-electrolyte interphase (SEI) and as lithium dendrites after charge-discharge cycles. On some particles no Li signal was detected, whilst EDS spectra from others showed a significant Li peak.
Fig. 1 shows the same lithiated graphite particle before and after prolonged exposure to the electron beam. The particulate matter formed during exposure to the electron beam is clearly visible on the surface of the particle in Fig. 1b. From the EDS spectrum we can conclude that significant amounts of Li are present close to the surface of the particle based on the information depth for graphite at 3 kV. The origin of this Li is being investigated, in particular whether it is formed from Li in the graphite samples, from the surface SEI layers or from Li dendrites deposited during cell cycling and whether Li diffusion depends on the grain orientation. Importantly, the results indicate that Li is highly mobile under the influence of the electron beam and therefore any quantitative measurements have to be interpreted with caution.
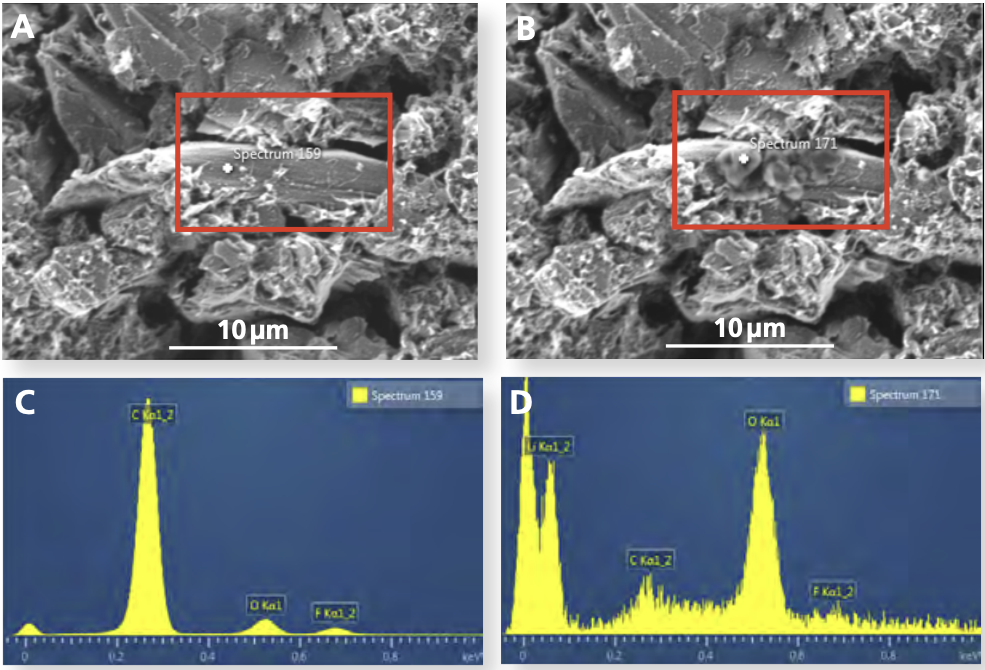
Fig. 1. (A) Graphite particle before electron beam irradiation and (B) after irradiation. (C) EDS spectrum before prolonged irradiation (no Li detected) and (D) after irradiation (showing a Li signal).
Thickness Measurement of Li Layer
Without measuring Li X-rays directly, it is possible to estimate the thickness of a hypothetical surface layer of lithium by using AZtec® LayerProbe®. To show this, we studied a sintered pellet of Li1.4Al0.4Ge1.6(PO4)3 which is a solid electrolyte with an ionic conductivity of 0.3 mS/cm at room temperature. A part of the pellet was in contact with lithium foil for several days, after which the lithium foil was removed before the EDS measurement took place.
We compared EDS spectra from the sample surfaces with and without exposure to lithium based on the assumption that Li has transferred from the Li foil to the sample, forming a Li rich surface layer. Comparing the EDS spectra from the regions with and without exposure to lithium shows a distinct attenuation of the O K, Ge L, Al K and P K lines in the region which was in contact with the lithium foil (Fig. 2). The height of the carbon peak which can be attributed to surface contamination is of approximately equal height in both spectra, ruling out a geometric effect such as shadowing or surface tilt. AZtec LayerProbe calculates the thickness of a hypothetical layer of lithium on the Li1.4Al0.4Ge1.6(PO4)3 pellet based on the attenuation of X-rays emitted from inside the sample.
Assuming a layer of metallic lithium (ρ = 0.53 g/cm3) covered the contacted part of the sample, LayerProbe calculates that a thickness of 100–150 nm of lithium would result in the observed attenuation of the X-ray signals from Li1.4Al0.4Ge1.6(PO4)3. In contrast, EDS did not detect attenuation of the O K, Ge L, Al K and P K lines for the part of the sample which had not been in contact with the lithium foil.
Conclusion
The results indicate the great potential of SEM/EDS for the characterisation of lithium ion battery materials. It shows that while it is possible to detect Li X-rays from those materials using the Extreme detector, the results may be difficult to interpret due to the mobility of Li under the electron beam. However, it is also possible to study lithiation processes indirectly, by using the attenuation that a hypothetical surface layer of lithium exerts on the X-ray emissions of other elements in the sample.
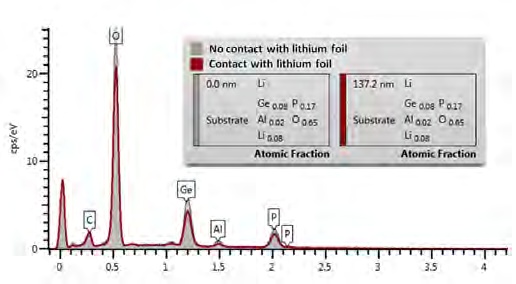
Fig. 2. EDS spectra and Li layer thickness estimation from the areas of the sample having been in contact and not in contact with Li.
References
- Burgess S, Li X, Holland J. 2013 Micro Anal 27:S8–S13.
- Hovington P, Timoshevskii V, Burgess S. et al 2016, Scanning, in print.

