Application Notes
Rock Core NMR - 12MHz versus 2MHz: Why Go to Higher Field?
Published: 03 Nov 2026 · Last updated: 03 Nov 2026
This Application Note was created in collaboration with Green Imaging Technologies

Rock Core NMR - 12MHz versus 2MHz: Why Go to Higher Field?
Nuclear Magnetic Resonance (NMR) laboratory based core analysis has been performed for over 20 years, and for much of that time most of the measurements have been carried out at 2MHz. Laboratory based NMR rock core analysis was first devised to calibrate well logs which were collected using down hole NMR tools that operated at 2MHz, so it made sense to use 2MHz instruments in the laboratory. In recent years, as laboratory based NMR has expanded its tool box of measurements beyond well log measurements, and as more unconventional rocks are scanned, the tendency to use 2MHz is changing.
The sensitivity of NMR instruments increases with operating frequency, such that sensitivity at 12MHz is more than 10 times that at 2MHz, making measurements up to one hundred times faster. While the minimum echo spacing, and thus the smallest detectable pore size, are very similar for 12MHz and 2MHz instruments, the greater sensitivity of a 12MHz instrument means that adequate signal can be acquired from small pores in less time, with fewer scans.
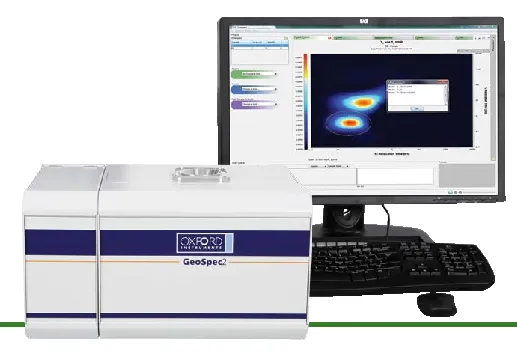
So, should users with 2MHz NMR benchtop systems upgrade to higher field instruments such as the 12MHz GeoSpec+? What are the advantages? This technical note will lay out the advantages of a 12MHz GeoSpec versus a 2MHz GeoSpec with the aim of answering these questions.
Method
The University of Oklahoma's Mewbourne School of Petroleum and Geological Engineering has completed a study comparing the 2MHz and 12MHz NMR responses, and much of this technical note is based on their findings. To properly compare results, one must ensure the same samples are compared and that no alteration occurs to the sample between measurements. Table 1 below shows the samples used in this comparison.
| Samples | Porosity % | Permeability md |
| Berea Sandstone | 19 | 157 |
| Tennessee Sandstone | 4 | 0.003 |
| Lyons Sandstone | 10 | 0.006 |
| Fontainebleau Sandstone | 7.2 | 25.5 |
| Kansas Limestone | 18 | 8.5 |
| Fused Glass Beads | 37 | 35,800 |
| Aluminum Oxide | 45 | 20,100 |
| Eagle Ford Shale | 6 | - |
| Utica Shale | 5 | - |
| Woodford Shale | 8 | - |
The samples were scanned using a GeoSpec 2MHz rock core analyser and a GeoSpec 12MHz rock core analyser, both owned by the University of Oklahoma.
All samples were cleaned using Soxhlet extraction at 100C, then dried in a vacuum oven for 12 hours, and finally saturated with dodecane at 7000psi for 48 hours.
Signal to Noise (SNR) Comparison
If the same measurement time (number of scans) is used, the higher frequency of the 12MHz GeoSpec results in about 15 times more NMR signal being captured, meaning the SNR will be substantially higher. This is illustrated in Figure 1. As one would expect, high permeability samples have a higher SNR than low permeability samples.
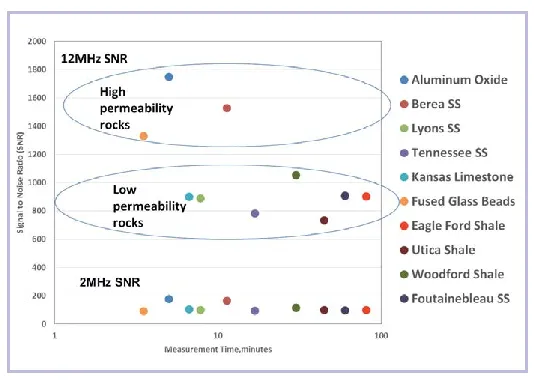
Fig. 1 — SNR vs measurement time. All data were collected with a TE of 300μs. The upper circled data are from the 12MHz system while the lower circled data points are from the 2MHz.
T2 Spectra Shift
When comparing T2 spectra measured at 2MHz with those measured at 12MHz, the 12MHz spectra can be seen to shift left and become better defined. The leftward shift can be explained by the fact that the higher frequency of the 12MHz GeoSpec causes faster relaxation of hydrogen protons at the pore walls, so the observed T2s are shorter and the T2 spectra shift left.
Figure 2 shows the T2 spectra from the same sample measured at 2MHz and 12MHz and illustrates the spectra shift.
In the Kansas limestone, the 12MHz spectrum is bimodal, which can be attributed to the higher SNR of the 12MHz GeoSpec, resulting in better visibility of the smaller pore spaces.
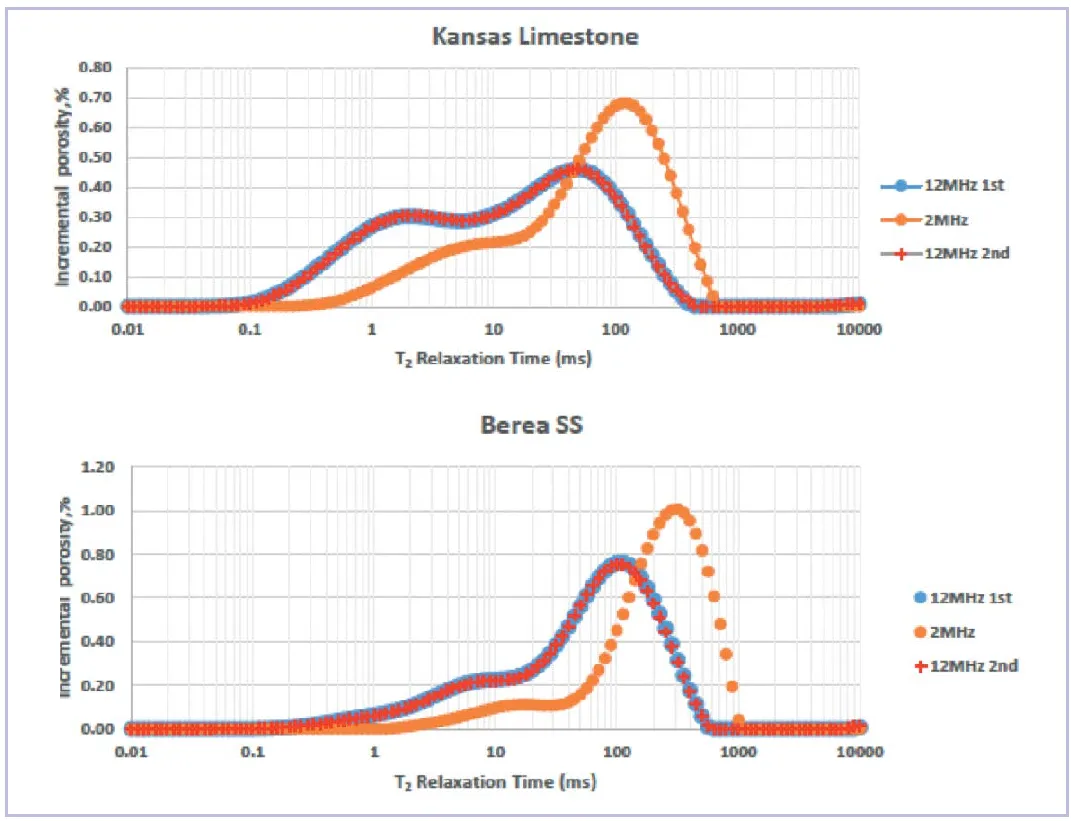
Fig. 2 — T2 spectra of two samples measured at 2MHz and 12MHz at Tau=75μs.
2D Correlation Maps
One of the key areas of interest in laboratory based NMR core analysis measurements in recent years has been 2D correlation maps, which measure two parameters and correlate them in a 2D map. The two most popular are the T1-T2 map and the T2-Diffusion map. Both these maps are signal intensive and if one can measure at better SNR one gets better defined maps and gets them more quickly.
As seen above with the T2 spectra shift, the 12MHz GeoSpec provides better resolution of the T2 (and T1) spectra, which means the correlation between the two in a T1-T2 map is better defined, or put another way, the data populations will be better separated and better defined on the maps. While 2D maps have been produced successfully at 2MHz, the 12MHz GeoSpec instrument with Q-Sense probe technology offers significantly better SNR and thus can make these signal intense measurements more quickly and with better resolution. 2D map measurements not only require 4 times as much data as a 1D measurement, but also require the data to spread over a larger area due to the 2 dimensional nature of the measurement.
Conclusions
It has been determined in independent tests by Oklahoma University's Mewbourne School of Petroleum and Geological Engineering, that a 12MHz GeoSpec NMR rock core analyser can obtain an SNR that is an average of more than 11 times higher than the SNR obtainable on the 2MHz GeoSpec, in high porosity samples. In low porosity samples such as shales, using the same number of scans in each instrument, the SNR is an average of almost 9 times higher in the 12MHz instrument.
The 12MHz GeoSpec has distinct advantages over the 2MHz system in terms of signal to noise ratio. The vastly better SNR means measurements are acquired more quickly, and allow for better resolution in T2 spectra, more accurate porosity measurements with tight rock cores, better defined 2D correlation maps, and use of a wider range of signal filters.
References
- Comparison of 2MHz and 12MHz NMR Responses in Conventional and Unconventional Reservoir Rocks. B. Min, C.H. Sondergeld, C.S. Rai, Society of Petrophysicists and Well Log Analysts.