Application Notes
Rapid Non-Destructive Capillary Pressure Measurements with NMR
Published: 03 Nov 2026 · Last updated: 03 Nov 2026
This Application Note was created in collaboration with Green Imaging Technologies

Introduction
Capillary pressure is a critical parameter for the oil exploration and production industry, and is a common measurement performed in core analysis laboratories. However, traditional techniques such as porous plate, centrifugation and mercury injection are laborious, time consuming and expensive.
The method described here was first reported by Dr. Derrick Green of Green Imaging Technologies at a meeting of the Society of Core Analysts in 2007. Called GIT-CAP™, it centrifuges core plug samples and then directly measures the water saturation distribution in them using a one-dimensional NMR profile (a simplified version of Magnetic Resonance Imaging, or MRI). This technique is as accurate as porous plate and is 5 times faster than traditional centrifuge capillary pressure measurements.
Method
The patented GIT-CAP capillary pressure measurement technique uses capillary pressure theory combined with NMR-determined saturation profiles, allowing for the accurate development of capillary pressure curves. With this technique, the core plug is first fully saturated with brine, and is then centrifuged to create a distribution of fluid in the plug which is in turn dependent on capillary pressure. The fluid distribution is quantified using NMR. The capillary pressure at each position along the plug at hydrodynamic equilibrium is derived from equation (1), where Pc(r) is the capillary pressure at the given radial position, Δρ is the density difference of the two fluids, ω is the rotational speed and r2 is the distance to the outlet face of the plug.
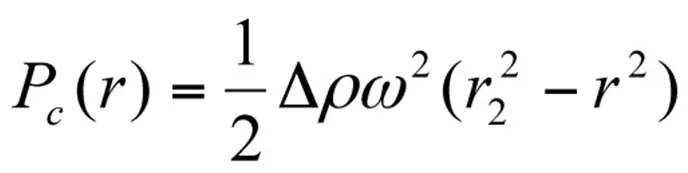
This equation assumes that the outlet boundary condition of 100% water saturation (or zero capillary pressure) is maintained. This means in any centrifuged plug, there will be a distribution of saturations from 100% at the outlet to water saturation at the inlet (governed by the rotational speed). The saturation at the corresponding positions is measured using NMR (illustrated in Figure 1).
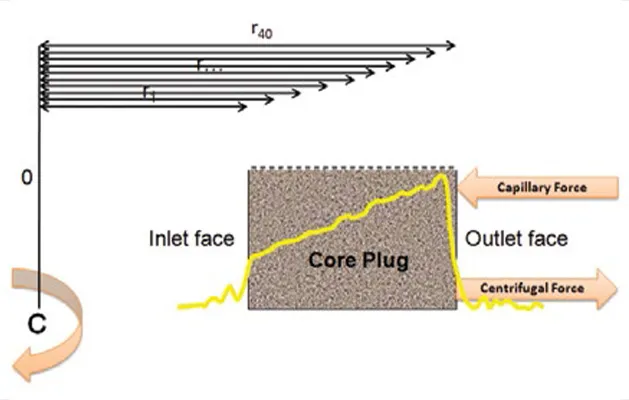
Fig. 1 — GIT-CAP capillary pressure technique measuring 30–40 data points
Saturation profiles acquired after centrifugation at different speeds can be plotted on the same curve expanding the range and resolution of the capillary pressure curve. This technique was proven to work on a wide range of samples (Reference 1). Accurate saturation profiles are ensured by using advanced SPRITE-based MRI techniques (Reference 2).
Results
Typical results are shown in the following figures for two sandstone samples. The associated saturation profiles are also shown to illustrate the amount of fluid movement within the samples at each centrifuge speed.
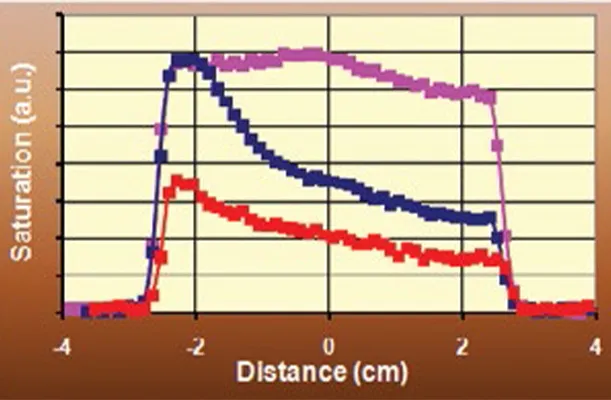
Fig. 2a — Saturation profiles for Figure 2b
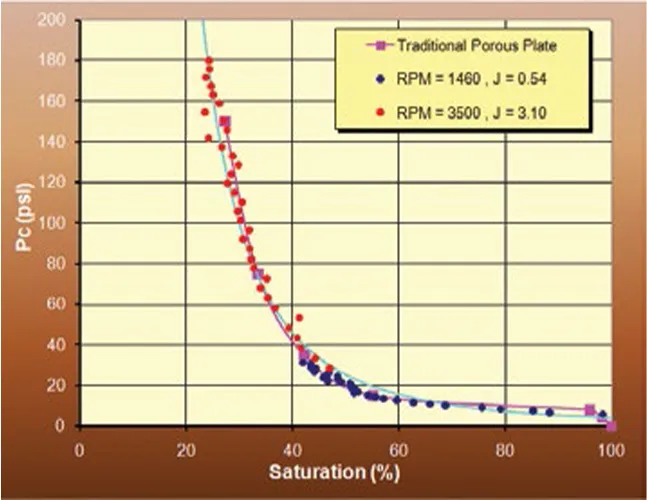
Fig. 2b — GIT-CAP capillary pressure curve for sandstone sample with a permeability of 5.74% and porosity of 20.4 mD
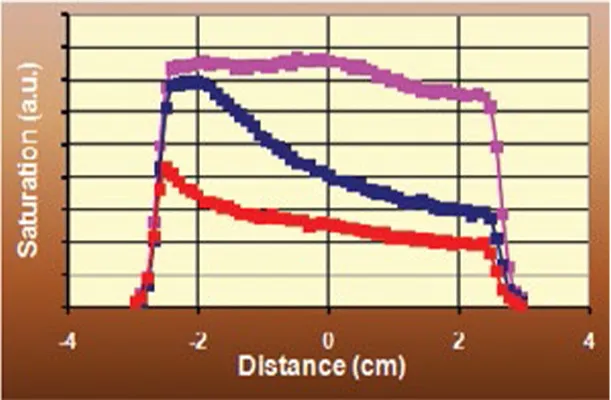
Fig. 3a — Saturation profiles for Figure 3b
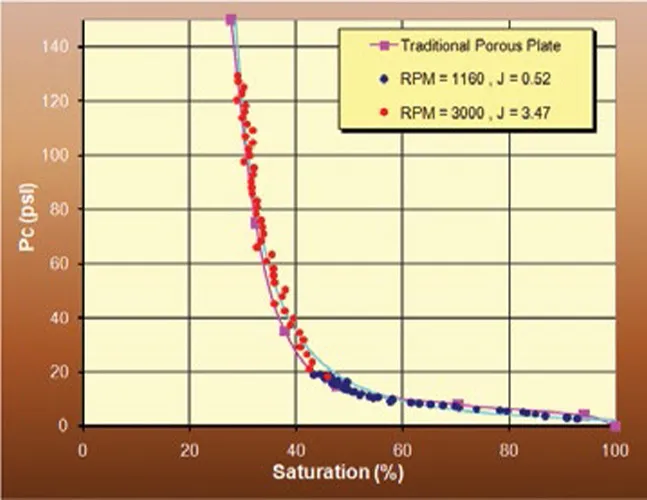
Fig. 3b — GIT-CAP capillary pressure curve for sandstone sample with a permeability of 13.7% and porosity of 9.7 mD
As can be seen in these figures, this technique only requires two different centrifuge speeds to determine the full capillary pressure curve. The obvious advantage is that the result is obtained in a fraction of the time required for other traditional measurement techniques but it is also an accurate, direct measurement. Furthermore, as the fluid distributions are measured directly within the sample, there is no requirement to collect and measure the amount of expelled fluid, meaning that the centrifuge apparatus can be simpler. The following table compares the GIT-CAP measurement technique to the traditional capillary pressure measurement methods:
| GIT-CAP Advantages | |
| Mercury Injection | Uses representative fluids |
| Non-destructive | |
| Direct measurement | |
| Simpler sample handling procedures | |
| Traditional Centrifuge | Speed (GIT-CAP takes days, centrifuge takes weeks) |
| Accuracy/more data (GIT-CAP provides 30-40 data points per centrifuge speed) | |
| Simpler centrifuge set-up (no costly upgrades required) | |
| Porous Plate | Speed (GIT-CAP takes days, porous plate takes weeks or months) |
| More data points |
With the inherent time and accuracy advantage, the GIT-CAP NMR measurement can help a laboratory increase their sample throughput by at least three times per centrifuge.
Hardware
The advantages of the GIT-CAP measurement are bolstered by the GeoSpec hardware, which has substantially decreased acquisition times, as well as an increased signal to noise ratio. Decreased acquisition times make the GIT-CAP measurement even faster while the increased signal to noise ratio and short echo times ensure the data collected is more accurate. Measurements are controlled by the GIT-CAP software and can be made easily by core laboratory technicians without indepth knowledge of NMR techniques.
Conclusion
Capillary pressure measurements using the GIT-CAP method are substantially faster than those made by traditional techniques, particularly for low permeability samples with longer equilibrium times. They also provide significantly more data points, allowing more accurate prediction of additional parameters such as pore throat distributions, wettability, and relative permeability.
The Oxford Instruments – Green Imaging Technologies Partnership
Until recently, a high level of expertise and knowledge of the principles and practice of NMR has been needed to perform NMR core analysis. Consequently, NMR core analysis has been confined to a relatively small group of Special Core Analysis Laboratories. A partnership between Oxford Instruments and Green Imaging Technologies brings optimised hardware and software to improve performance and enable any core analysis laboratory to generate the petrophysics values that the industry needs without the requirement that every dataset be analysed by an NMR expert. Now, any core analysis laboratory can add NMR to the techniques they can offer, allowing well log calibration and giving fast measurements of:
- Total Porosity
- Pore Size Distribution
- Bulk Volume Irreducible (BVI)
- Free Fluid Index (FFI)
- Clay Bound Water (CBW)
- Effective Porosity
- Permeability
- Capillary Pressure
- Gas/Water Content
- Oil/Water Content
- Shale Analysis
- Water/Bitumen Content
References
- Comparison study of capillary pressure curves obtained using traditional centrifuge and magnetic resonance imaging techniques. D.P. Green, J.R. Dick, J. Gardner, B.J. Balcom, B. Zhou. International Symposium of the Society of Core Analysts, Calgary, Alberta, Canada, (September, 2007)
- Spatially resolved measurement of rock core porosity. F. Marica, Q. Chen, A. Hamilton, C. Hall, T. Al, B.J. Balcom. Journal of Magnetic Resonance 178, 136–141. (2006)