Introduction
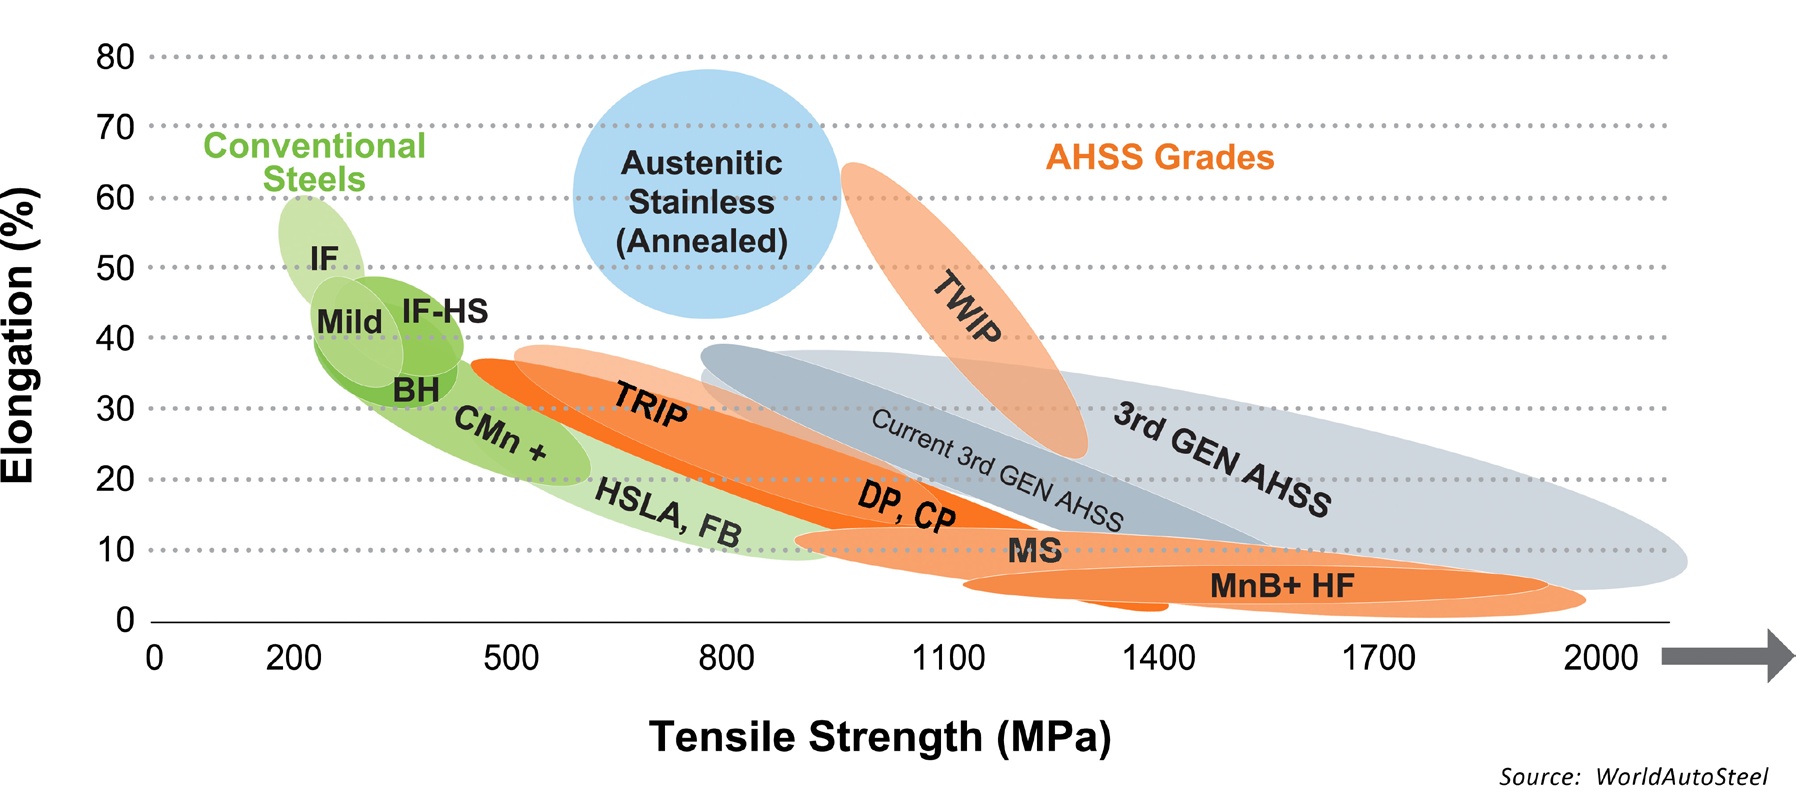
The development of high strength steels has, for many years, been critical for the continued use of steel within the automotive industry. Recently a new class of steels known as "Advanced High Strength Steels" (AHSS) has been introduced: these offer significant improvements in strength over conventional high strength steels and, importantly, maintain high ductility and formability. Initial AHSS developments included Dual Phase (DP), Complex Phase (CP) and Martensitic (MS) steels; however, there is currently significant interest in the so-called 3rd Generation AHSS, as these offer further benefits in both strength and formability (e.g. Figure 1).
These 3rd Generation AHS Steels offer superior mechanical properties at a lower cost than previous AHSS classes, enabling automotive manufacturers to reduce the weight of cars whilst maintaining or even improving on structural integrity and rigidity, thus lowering the vehicle's carbon footprint.
In order to understand the influence of processing parameters on the mechanical properties of the steel, detailed classification of the microstructures is required. In particular, rigorously determining the phase fractions is critical, yet not straightforward. Many of these steels contain phases (such as primary and secondary martensite, bainite, ferrite etc.) that can be difficult to characterise effectively using either optical or electron microscopy techniques, due either to resolution limitations or crystallographic similarities.
In this brief application note we look at 2 samples of a representative 3rd Generation AHS Steel and demonstrate how the latest generation Oxford Instruments electron backscatter diffraction (EBSD) system can effectively analyse and classify the microstructures in a matter of minutes, offering significant potential for the routine use of EBSD in this field in the future.
Material and Analytical Details
One type of AHSS is known as a quenching and partitioning (Q&P) processed steel. Q&P steels were first proposed in 2003 [1] and are formed using a 3-step process. Firstly the austenitised steel is quenched to partially transform to a primary martensite; then follows a higher temperature "partitioning" stage in which carbon atoms diffuse from the primary martensite into the untransformed austenite, and this is followed by a final quenching to room temperature. The austenite is stabilised by the C-enrichment, resulting in high levels of retained austenite in the final microstructure. However, if the partitioning stage does not permit sufficient diffusion of C, then some austenite can transform to secondary martensite upon final quenching. Given that the mechanical properties of Q&P steels are a function of the volume fraction of the phases present, it is essential to be able to classify the microstructural phases rigorously and consistently.
In this study we have utilised EBSD in combination with energy dispersive X-ray spectrometry (EDS), providing a unique combination of crystallographic and chemical information on the sub-micrometre scale. Recent developments in both EBSD detector technology and software processing have enabled high-throughput characterisation of samples in just a few minutes, making it a cost-effective routine analysis tool. Here two Q&P steel samples with significantly different mechanical properties have been analysed in a field emission gun scanning electron microscope (FEG SEM) using a beam current of 16 nA and an accelerating voltage of 20 kV. The diffraction patterns have been collected using the Symmetry S2 EBSD detector in Speed 2 mode and analysed using the AZtec acquisition platform. Both datasets are the same size (1.17 million analyses) and each took 12 minutes to collect at a rate of 1600 pps, using a measurement step size of 70 nm.
The data were subsequently exported into the AZtecCrystal data-processing software for in-depth analysis, with individual phases being identified using a novel machine-learning based classification tool. Here, a user can train the system to recognise different phases in a dataset, utilising various EBSD-related parameters (such as diffraction pattern quality, grain size, local plastic deformation etc.), and then apply that classification recipe to other datasets. This is particularly powerful for high strength steels, as it is usually challenging or impossible to differentiate between martensite, ferrite and bainite on the basis of their crystallographic structure alone and, with many of the key structures on the scale of 1–5 micrometres, optical classification becomes impossible due to resolution limitations.
Application Results: Q&P Processed Steels
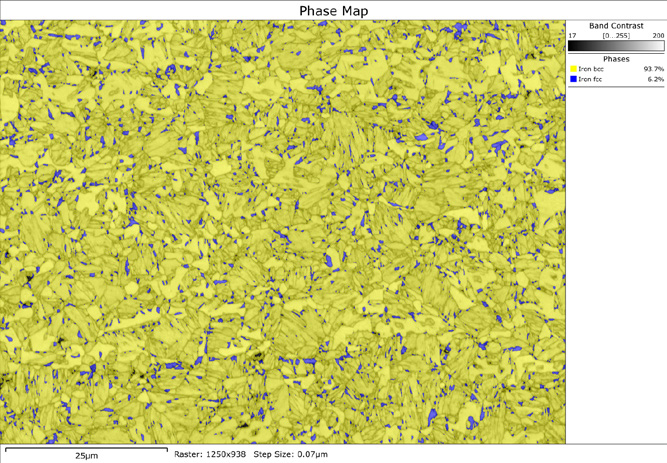
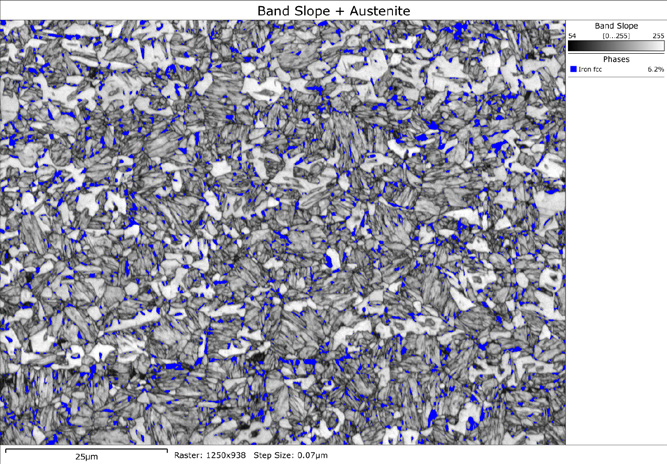
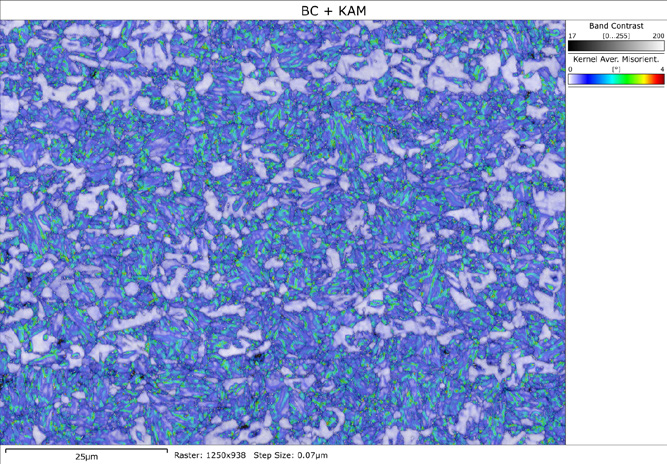
The initial EBSD results from the first Q&P steel sample are shown in Figure 2: each analysis point has been indexed either as ferrite (body centred cubic – BCC) or austenite (face centred cubic – FCC). However, the pattern quality map in (b) (here determined using the band slope, an expression of the sharpness of the Kikuchi band edges in each diffraction pattern), highlights the fact that the regions indexed as ferrite could clearly be further subdivided into sub-regions with high and low quality patterns, represented by lighter and darker shades respectively. In addition, the Kernel Average Misorientation (KAM) map in (c), highlighting variations in plastic deformation and defect density, further accentuates differences between regions indexed as ferrite.
(a)
(b)
(c)
Thresholding single parameters does not result in a good separation of phases due to the variability within individual grains (for example in defect density and subsequent diffraction pattern quality), and so 3 separate parameters have been used to classify the phases within this dataset:
- The Kernel Average Misorientation value (i.e. the local gradient of crystallographic orientation change around each measurement point) – see Figure 2c
- The mean pattern quality (band slope) within each measured grain
- The mean orientation spread within each measured grain
These 3 chosen parameters enable a successful classification of the microstructure into the following phases:
- Retained austenite (as indexed)
- Ferrite (good diffraction patterns, low intragranular distortion)
- Primary martensite (lath structure with significant intragranular distortion)
- Secondary martensite (very poor pattern quality)
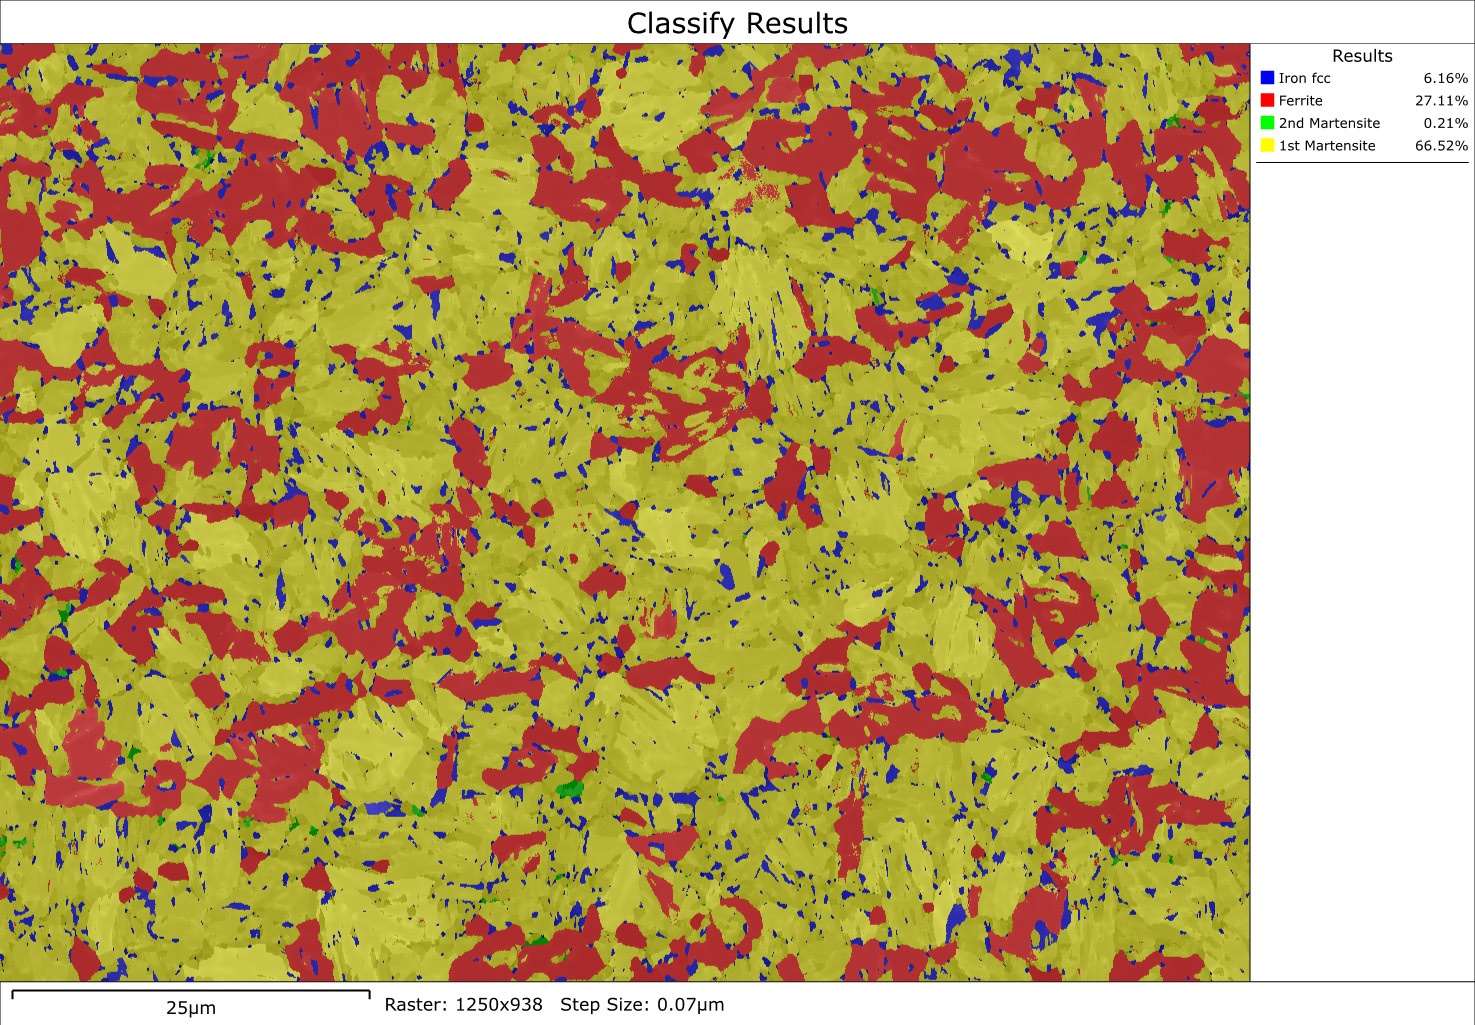
The final classification map is shown in Figure 3a: it is possible to correlate visually the classification results with the corresponding regions in the KAM and pattern quality maps shown in Figure 2.
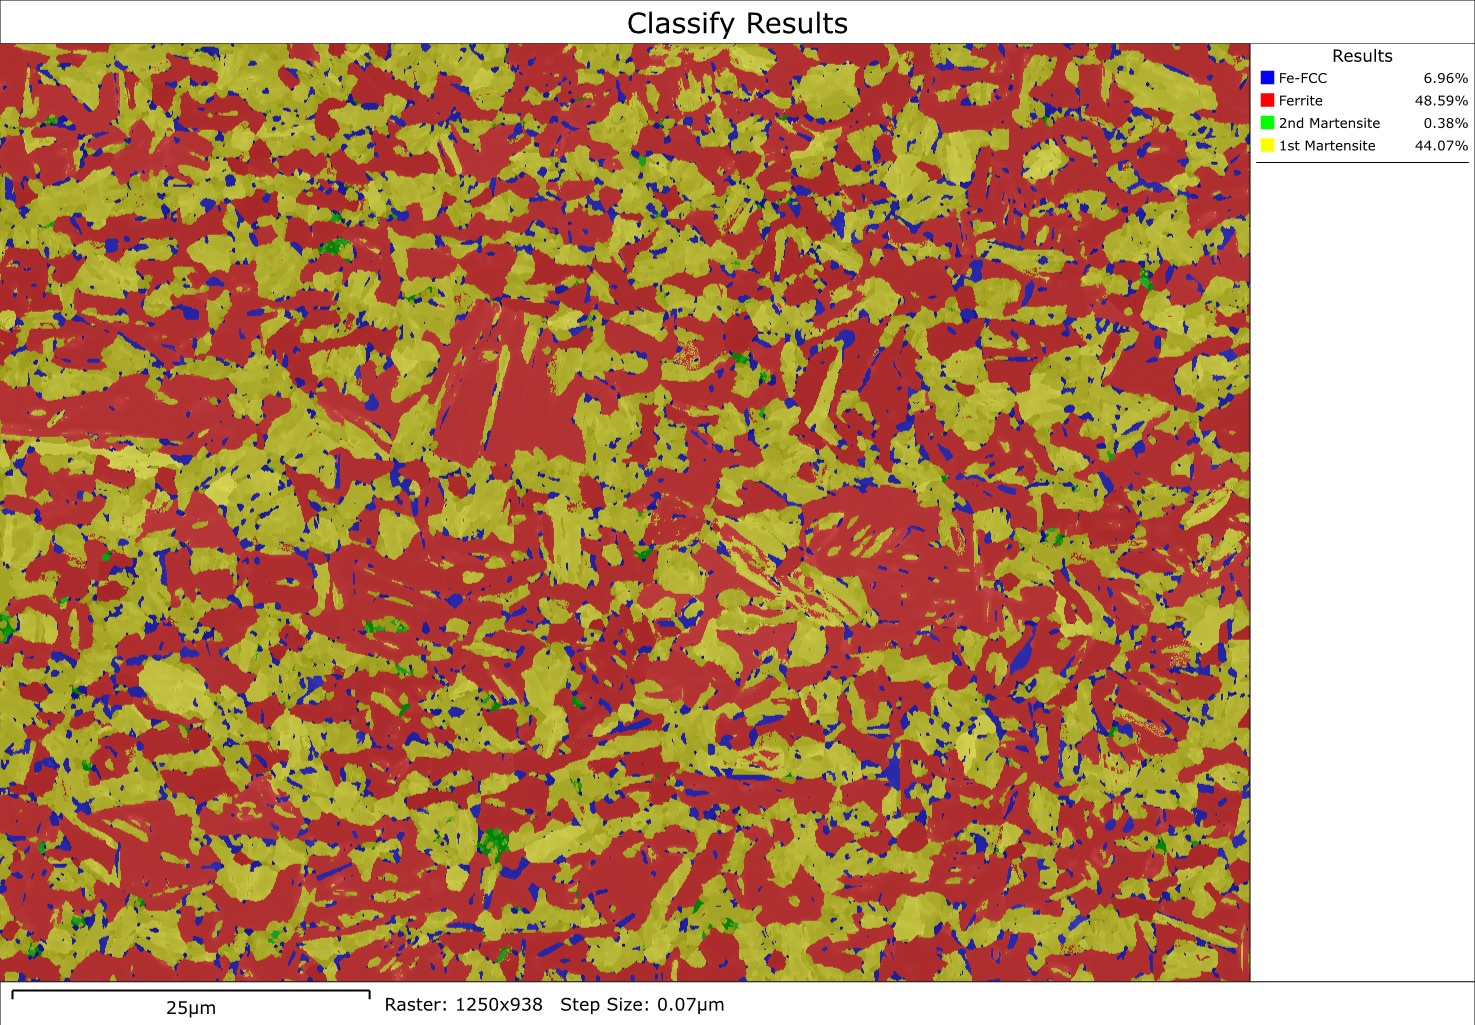
The contrasting mechanical properties of the 2nd sample were suspected to be due to a difference in the final phase fractions following Q&P processing. The classification recipe utilised for sample 1 was then applied to sample 2, with the results showing a significantly higher fraction of ferrite and a correspondingly lower fraction of primary martensite (see Figure 3b and Table 1).
| Phase | Sample 1 | Sample 2 |
| Retained Austenite | 6.16% | 6.96% |
| Ferrite | 27.11% | 48.59% |
| Primary Martensite | 66.52% | 44.07% |
| Secondary Martensite | 0.21% | 0.38% |
Table 1. Summary of the phase fractions for samples 1 and 2.
The difference in mechanical properties between the 2 samples can therefore be easily explained by the different final fraction of ferrite and primary martensite, and this in turn allows the necessary modifications to be made to the quenching and partitioning stages of any subsequent steel production process.
(a)
 (b)
(b)
Fig 3. Figure 3. (a) The results of the classification process for sample 1 using AZtecCrystal. (b) The results of the classification process for sample 2, using the same classification recipe.
Summary
This application note demonstrates the suitability of EBSD for the rapid and effective characterisation of the all-important phase fractions in advanced high strength steels. The unparalleled combination of the Symmetry S2 detector, the AZtec acquisition platform and AZtecCrystal's Classify Tool has enabled each sample to be measured and classified in approximately 15 minutes; the results provide compelling evidence that a difference in phase fraction has caused the observed change in mechanical properties between these 2 Q&P processed steel samples.
References
[1] J. Speer, D.K. Matlock, B.C. De Cooman and J.G. Schroth (2003). Carbon partitioning into austenite after martensite transformation. Acta Materialia 51, 2611–2622.

