For non-destructive investigations of the chemical nature of materials in the liquid state, NMR spectroscopy is an
extremely versatile method employed extensively in research and development. NMR provides information about individual
atoms within the compounds, including not only their chemical environment and molecular structure, but also on their
quantity. This makes the technique an ideal tool for rapid reaction monitoring and quality control. However, due to
the high cost as well as demanding staff and environmental requirements, traditional high-field NMR instruments with
their high maintenance superconducting magnets are difficult to integrate into an existing workflow.
By employing modern benchtop NMR instruments instead, those disadvantages can be eliminated. These instruments use a
low maintenance permanent magnet, are much easier to operate and, due to their mobile and compact nature, can be
easily located in existing workspaces. In particular, the X-Pulse broadband benchtop NMR spectrometer delivers high
resolution and sensitivity, suitable for qualitative as well as quantitative measurements, with many applications
taking just a few minutes.
NMR spectroscopy characterises the chemical structure of battery electrolyte solvents and additives. Importantly,
quantitative broadband benchtop NMR additionally determines the precise concentrations of solvents, trace impurities,
additives, and decomposition products. In this application note, we highlight the relevant quantitative NMR (qNMR)
experiments and their importance for optimising next generation battery performance, raw materials checking and
improving quality control.
In an NMR spectrum, the areas under peaks are directly proportional to the number of the atom(s) they are generated
from. Quantitative NMR (qNMR) uses this property to determine the ratios or absolute concentrations of species in a
sample. Accurate quantitation can easily be done, when the signals of interest are discrete and well defined,
emphasising the importance of spectral resolution.
Introduction — Lithium-Ion Batteries
The increasing number of mobile devices as well as the switch away from fossil fuels towards sustainable energy
solutions has turned the development of efficient batteries into a critical challenge of our times. Lithium-ion
batteries have proven to be commercially successful, with ongoing improvements to their components making them
increasingly sophisticated and powerful. The electrolyte is one key component with many opportunities for
optimisation. In most current commercial batteries, the electrolyte is a liquid consisting of an organic solvent in
which lithium salts are dissolved to enable movement of charge carriers between the electrodes. In addition, chemical
additives may also be present in the mixture to enhance properties such as chemical stability and battery life cycle.
A schematic version of such a battery is shown in figure 1.
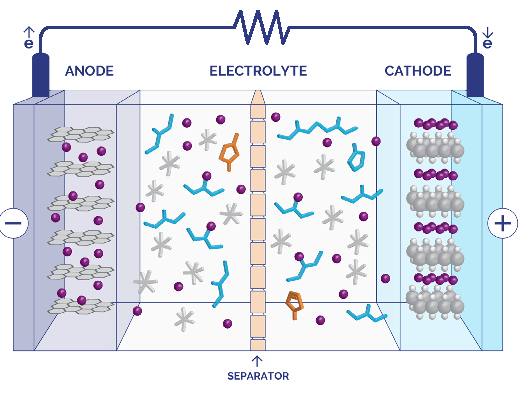
Fig. 1 — Schematic of a lithium-ion battery
For research and quality control alike, exact knowledge about the composition and concentration of the electrolyte is
of paramount importance to achieve maximum performance. The X-Pulse is an ideal instrument for quick and reliable
analysis of such systems. As the only benchtop spectrometer with broadband capabilities, the X-Pulse provides all the
capabilities necessary for the investigation of a variety of X-nuclei such as phosphorous, lithium or boron present in
electrolytes, as has already been shown previously in Application Note 16: "Multinuclear Benchtop NMR for
Electrolyte Design". The X-Pulse is also capable of exact concentration measurements of more traditional
hydrocarbons, like alkyl carbonates, that are used both for the solvent as well as additives in batteries.
Quantifying Mixtures of Solvents
Alkyl carbonates like ethylene carbonate (EC), dimethyl carbonate (DMC) and diethyl carbonate (DEC) are widely used
aprotic polar solvents in electrolytes for lithium-ion batteries. Knowledge of the precise compositions of these
solvents, together with various additives is required to optimise properties such as viscosity or permittivity, as
well as their long-term chemical stability. The composition of such mixtures can be quantified in a few minutes on the
X-Pulse using simple one-dimensional 1H spectra, with sufficiently long relaxation time between each scan.
Such an electrolyte mixture of an approximate 1:1:1 ratio by mass was analysed by such an experiment with 16 scans. To
achieve accurate quantitative results in qNMR, you need to allow the nuclei to return to the equilibrium state before
each scan. Therefore, we are using a 20 second relaxation delay between the scans for optimal accuracy. The resulting
spectrum is shown in figure 2 below.
We can clearly see the separate singlet signals of EC and DMC, as well as the two distinct multiplets stemming from
the chemically inequivalent protons in DEC splitting into a triplet and a quartet, respectively due to coupling
between them.
In addition to this chemical and structural information, the area under each of those signals is proportional to the
number of nuclei producing them, enabling us to quantify the compounds and determining their ratio R
by measuring the signals integrals intensity I
. The EC signal intensity is normalized to a value of 4 protons, which leads to a value of 6.05 protons for DMC, 3.16
for the CH2 site of DEC and 4.60 for its CH3 group. Considering the number of hydrogen atoms at
those sites per molecule (six for DMC and four and six respectively for DEC), dividing the integral intensity by those
values gives us a molar ratio of 1.00 : 1.01 : 0.78 or of roughly 4:4:3, with the value for EC being obtained by the
average of its two signals.
R
molar = I
measured / I
expected
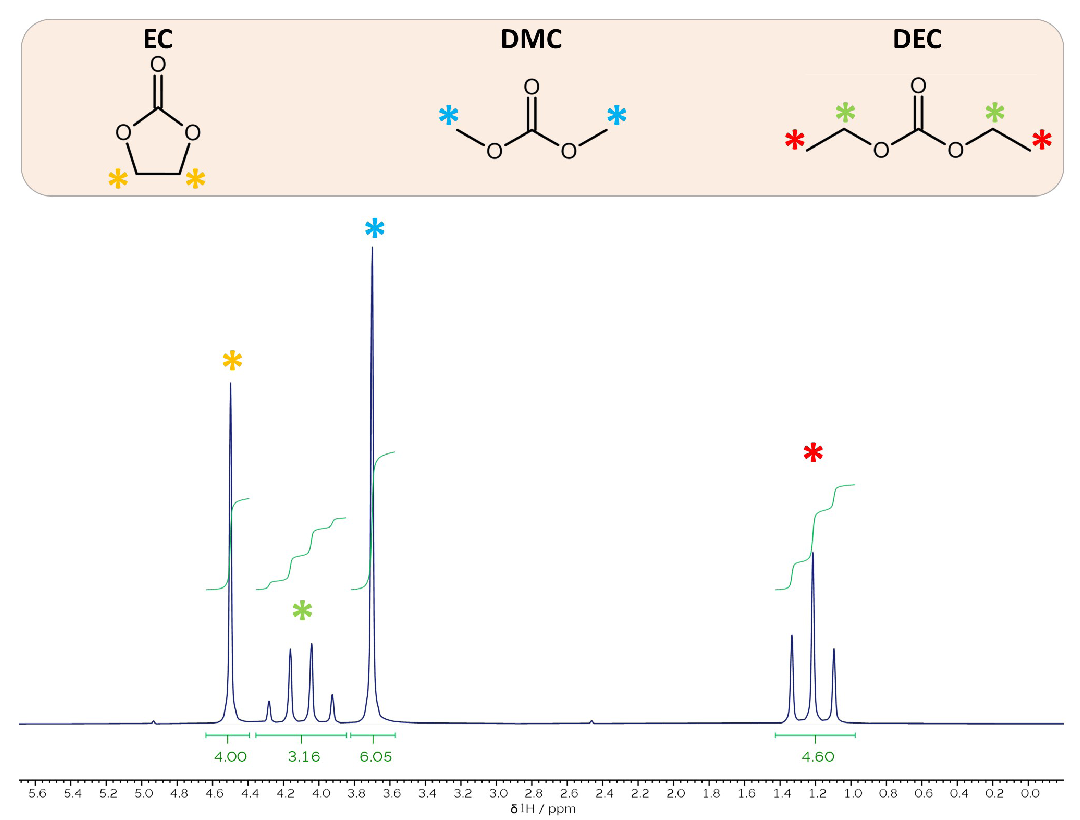
Fig. 2 —
1
H-NMR spectrum of a mixture of ethylene carbonate, dimethyl carbonate, and diethyl carbonate
When weighing those ratios with the molecular mass M
of each molecule, their ratio by weight as well as their weight percentage can be obtained.
R
weight = R
molar · M
The deviation of the values obtained compared to the mass ratios given by the manufacturer of the solvents is less
than two percent in each case, which proves the high accuracy obtainable in such a short amount of time and effort
(see Table 1).
|
Normalised integral (I |
measured) |
Molar ratio (R |
molar) |
Molecular Mass/g·mol-1 (M |
) |
Weight % (measured) |
Weight % (given) |
| EC |
4.00 |
1.00 |
88.06 |
32.51 |
32.97 |
| DMC |
6.05 |
1.01 |
90.08 |
33.54 |
33.69 |
| DEC |
3.16 (CH2) |
4.60 (CH3) |
0.78 |
118.13 |
33.95 |
33.34 |
Table 1: Molar and mass ratios of the carbonate mixture obtained via the integral area beneath their NMR signals
and their molecular mass.
Investigating Impurities and Trace Additives
Apart from quantifying majority components in mixtures, the X-Pulse is also capable of determining the amount of
trace impurities in a sample. As a model, one, two or four drops of vinylene carbonate (VC) were added to samples of
the same electrolyte used previously. VC is a compound used as an additive in electrolytes to generate an insoluble
polymer film at the solid-electrolyte-interface (SEI).
While the positive effects of the film formation include a decrease of the self-discharge rate of the batteries, as
well as improving the coulombic efficiency, a higher concentration of VC can lead to an unfavourable increase of the
cell's impedance. The concentration range optimal for such applications may lie below 2%, which makes accurate
analysis essential.[1]
By carrying out the same experiment as above, it is possible to obtain accurate results by integration of the
distinct NMR signal of VC in the aromatic region around 7.5 ppm, as is shown in the spectra below (figure 3).
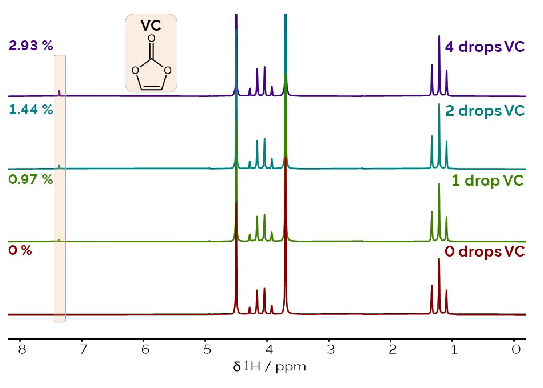
Fig. 3 —
1
H-NMR spectra of solvent mixtures with an increasing, yet small, amount of a VC additive
Using the same method as described above, the concentrations of VC were determined to be 0.97%, 1.44% and 2.39% by
weight in the three samples (see Table 2).
|
Normalised integral (I |
measured) |
Molar ratio (R |
molar) |
Molecular Mass/g·mol-1 (M |
) |
Weight % (measured) |
| 1 drop of VC |
0.08 |
0.04 |
|
0.97 |
| 2 drops of VC |
0.13 |
0.07 |
86.05 |
1.44 |
| 4 drops of VC |
0.17 |
0.09 |
|
2.39 |
Table 2: Quantification data of vinylene carbonate impurities in the carbonate mixture
Advanced Sequences — Eliminating 13C Satellites
When trying to accurately quantify closely spaced signals, the carbon satellites present in the usual one-dimensional
1H NMR experiments may not be able to be integrated easily together with their main signals and may overlap
with signals from other protons, causing small inaccuracies in measurements. Because those peaks only arise from
13C, which naturally comprises just 1.1% of carbon nuclei, the effects are generally very small. However,
when quantifying a very small peak, such as a minor impurity, that is adjacent to a much larger solvent peak, the
effects can be more significant. This source of error can be eliminated on the X-Pulse by a carbon decoupled
experiment, using techniques such as Globally optimized Alternating-phase
Rectangular Pulses (GARP). By removing the coupling between the hydrogen nuclei and
the small percentage of 13C nuclei that bind to them, the satellite peaks are eliminated, with the proton
signals all contained within the main peak (figure 4). This method slightly increases accuracy without prolonging
measurement time.
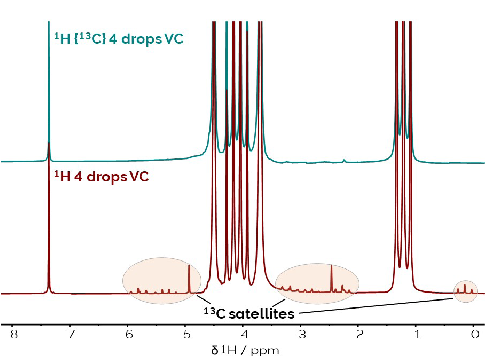
Fig. 4 — Zoomed in
1
H NMR spectra of the solvent mixture with four drops of VC without (bottom) and with (top)
13
C decoupling. The
13
C satellites in the lower spectrum are highlighted in orange.
Conclusion
Benchtop NMR is a practical method for use in quality and reaction control for its ease of use, non-destructive
nature, and versatile applications. The X-Pulse enables rapid investigations of not only the chemical structure of
electrolyte solvents and additives, but also the quantification of materials or impurities at much lower
concentrations. This method has been applied to solvents and additives of interest for battery research. Moreover,
eliminating the carbon satellites in 1H-spectra by decoupling using a GARP sequence enables accurate
measurements of even closely spaced signals.
While the examples in this Application Note use proton NMR spectra, qNMR experiments can also be performed on nuclei
including: 19F, 31P, 11B, 27Al, 7Li and 23Na, on a
single X-Pulse broadband benchtop NMR spectrometer. 19F, 7Li and 11B qNMR is of
particular significance for the analysis of electrolytes. 19F quantifies concentrations of the anions,
[PF6]−, [BF4]−, bis(fluorosulfonyl)imide (FSI) or
bis(trifluoromethane)sulfonimide (TFSI), as well as fluorinated additive and decomposition products. 7Li
accurately determines the concentration of lithium cations in the solution which is crucial for understanding the
energy density the final cell.
[1] J. C. Burns et al
J. Electrochem. Soc.
2011, 159
, A85

