Introduction
Papermaking has an over 2000-year-long manufacturing history and launched a revolution in communication and packaging. Over the centuries, paper's contribution to civilization is difficult to overstate and the refinement of its production processes continues to benefit many industries.
Paper typically consists of plant fibers from wood. Those fibers are mainly composed of cellulose and lignin. The properties of paper are determined primarily by the fiber composition. Processes and chemical treatments such as pulping, bleaching, sizing and coating further influence the characteristics of the produced paper including suitability for printing.
A thorough understanding of the micro- and nanostructures of the paper in its successive stages of production as well as the final paper composition at a sub-micrometer level is essential for further improvement of its properties. With nano-analytical investigation methods such as confocal Raman microscopy and atomic force microscopy (AFM) this detailed knowledge is readily accessible.
Confocal Raman imaging reveals valuable information about the spatial distribution of the chemical compounds while AFM delivers high-resolution images of physical surface properties (e.g. roughness). In combination, the techniques provide a comprehensive examination of the quality of the produced paper.
This application note presents results of confocal Raman and AFM measurements from several stages of the paper manufacturing process followed by examples that provide insight into printing and writing on paper.
Materials & Methods
All experiments were performed with a confocal Raman-AFM microscope of the WITec alpha300 series. The alpha300 series is optimized for high-resolution imaging of samples and is able to combine several analytical measuring techniques in one instrument such as diffraction-limited confocal microscopy, chemically sensitive Raman spectroscopy and cantilever-based scanning probe microscopy, including AFM and SNOM. Using these instruments it is possible to analyze the same sample position with various measuring techniques sequentially or even simultaneously (Raman and AFM). Automated measurement procedures and large area scans are also offered.
The microscope can be equipped with a selection of excitation lasers for confocal Raman microscopy. For the measurements presented in this application note, either a frequency-doubled 532 nm NdYAG laser or a 785 nm diode laser (NIR) was used. The excitation light was polarized horizontally (in the x-direction) with respect to the Raman image. All measurements were performed using an ultra-high-throughput spectrometer (UHTS) and back-illuminated CCD cameras.
The distribution of chemical species on the sample was determined in Raman spectral imaging mode. In this mode a complete Raman spectrum is recorded at every image pixel, producing a 2D array of Raman spectra. By extracting individual features such as Raman peak intensity, peak width or peak position from the recorded spectra, Raman images can be generated and fitting algorithms can be employed to visualize the distribution of compounds and characteristics. The illustration colors are coded in the same way as the corresponding spectra. The acquisition time for a Raman spectrum within a 2D spectral array was only a few milliseconds or 10s of milliseconds, allowing the acquisition of thousands of Raman spectra within minutes. The number of pixels and the integration times per spectrum are listed in the sections describing the corresponding Raman image throughout this document.
By rotating the microscope turret, it is possible to switch between confocal Raman microscopy and AFM without losing the sample position. The samples were imaged in AFM AC Mode using ArrowFM cantilevers (Nanoworld, Germany) with a resonance frequency in the range of 70–90 kHz and damping of r = 50 percent, recording both topography and phase images simultaneously.
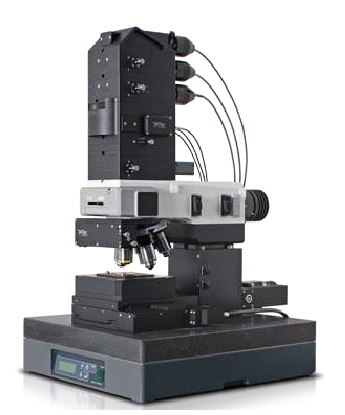
alpha300 Raman AFM microscope
Results & Discussion
Paper Production
Depending on the scope of use, paper has to meet multiple requirements, leading to variation in production methods. For the production of packaging paper with short fiber lengths and a yellowish color, mechanical pulping is sufficient. In this process, lignin is not removed from the pulp, which offers a high production yield. High quality paper for writing and printing requires chemical pulping. In this process the chemical structure of lignin is destroyed and dissolved in the pulp and can be washed off of the cellulose fibers. Furthermore, the fiber length is preserved for greater strength. The finished paper is then produced by feeding the pulp into a paper machine where it is formed as a paper web and the water is removed by pressing and drying. For specialty paper (photographic paper, technical paper, decorative paper, etc.) further treatments such as coating, laminating or impregnating are necessary in order to achieve the required properties. In the following, the spectral differences of pure cellulose are first illustrated then followed by the analysis of residues on cellulose fibers.
Raman Imaging of a Pure Cellulose Paper Web
Fig. 1a shows the video image of a paper web consisting of pure cellulose fibers. The red square in this video image indicates the area scanned in Raman spectral imaging mode using green excitation and a high numerical aperture air objective. An area of 50x50 µm² was scanned and a 2D spectral array of 128x128 complete Raman spectra was recorded with an integration time of 80 ms/spectrum. From this 2D array of spectra, two distinct spectra for cellulose were extracted and are shown in Fig. 1b. A significant difference between the two spectra can be seen in the intensity variation of the Raman bands at wavenumbers 1095 cm⁻¹ and 1118 cm⁻¹. These two bands are characteristic for C-O and C-C stretching, respectively, and are laser polarization-direction dependent. The distribution of these two Raman spectra over the examined surface area is presented in Fig. 1c. The color of the spectra in Fig. 1b matches the color in the Raman image 1c. Thus, pixels that are bright green show a high spectral similarity to the green spectrum, whereas bright red pixels show a high spectral similarity to the red spectrum. The laser polarization direction is indicated with the white arrow in Fig. 1c. Fibers oriented parallel to the laser polarization direction show an increased C-O stretching band at 1095 cm⁻¹ (red) compared to fibers oriented perpendicular to the laser polarization direction (green). Thus, confocal Raman microscopy easily reveals the orientation of cellulose fibers in the paper web even if this cannot be determined optically.
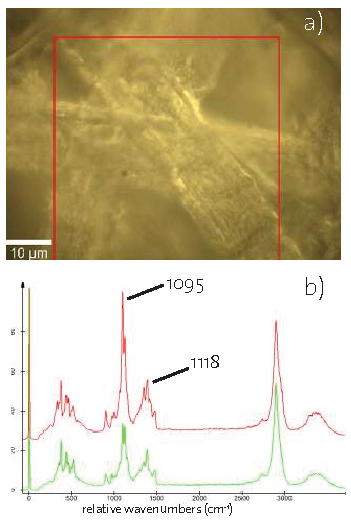
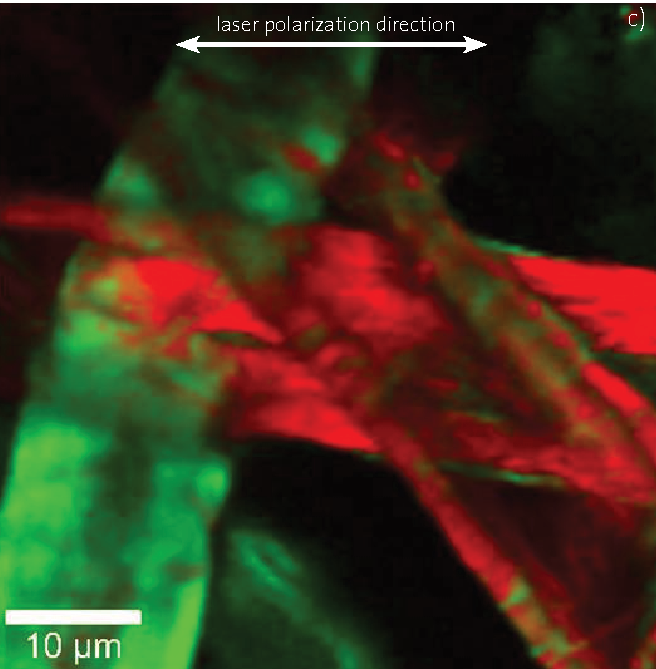
Fig. 1 — Confocal Raman imaging of raw cellulose fiber bundles. Video image (a), orientation-dependent Raman spectra of cellulose (b) and color-coded Raman image of cellulose fibers (c). Image area 50x50 µm², 128x128 pixels, integration time: 80 ms/spectrum.
Raman and AFM Imaging of Residues on Cellulose Fibers
As mentioned before, lignin is washed off of the cellulose fibers during the chemical pulping. Furthermore, small quantities of extractives such as resin acids, triglycerides, steryl esters, fatty acids, and sterols can be separated from wood by using solvents such as acetone or dichloromethane. During the papermaking process, these extractives are partly released into the circulation water. Today, efforts are made to decrease the water consumption in paper mills. Hence, water is re-circulated in the process, which leads to a build-up of dissolved and colloidal substances. The enrichment of extractives in the circulating water in particular leads to problems such as precipitates, paper strength decreases and foaming. The following two examples show studies of residues and their distribution on cellulose fibers.
Fig. 2 shows an example of a study of resin distribution in paper. For this experiment a sheet of paper was soaked in water to reduce the strong fluorescence of the sample. The alpha300 confocal Raman microscope was equipped with an NIR excitation laser and a back-illuminated deep depletion CCD camera. A water immersion objective (NA = 1.0) was used for these measurements. The video image in Fig. 2a shows several cellulose fibers oriented almost perpendicular to the polarization direction of the laser. The red square denotes the in-plane (x-y) scanned area of 45x17 µm². The blue line indicates where the depth (x-z) scan was performed. For the in-plane scan an array of 100x100 Raman spectra was recorded with an integration time of 112 ms/spectrum. Fig. 2b shows the characteristic Raman spectra extracted from the spectral array. The distribution of cellulose (red) and resin (green) on the analyzed sample area is shown in Fig. 2c. Fig. 2d shows a depth (x-z) scan of the sample. In this case an array of 100x100 Raman spectra was recorded over a range of 45x40 µm². The Raman images presented in Figs. 2c and 2d clearly show that the resin surrounds the cellulose fibers without penetrating into them.
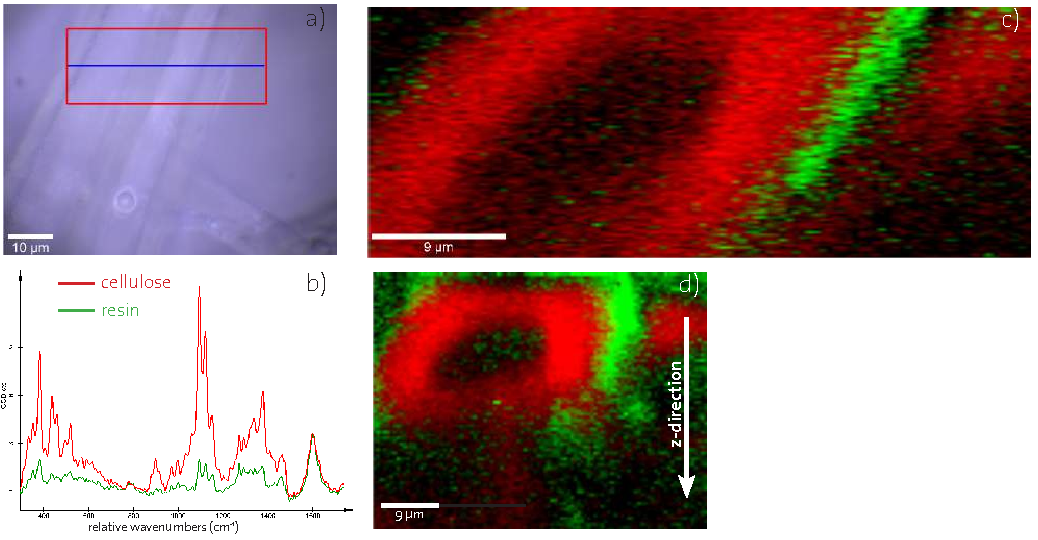
Fig. 2 — Confocal Raman study of resin distribution around cellulose fibers. Video image (a), Raman spectra of resin (green) and cellulose (red) (b), color-coded Raman image of a surface scan, image area 45x17 µm², 100x100 pixels, integration time: 112 ms/spectrum (c), and a depth profile, image area 45x40 µm², 100x100 pixels, integration time: 112 ms/spectrum (d).
A further survey was performed using the combination of confocal Raman and AFM to detect traces of wood extractives on pure cellulose fibers. An area of 20x40 µm² was scanned in Raman spectral imaging mode by acquiring a spectral array of 80x160 complete Raman spectra. From this spectral array three distinct spectra were extracted as shown in Fig. 3a. The green and blue spectra are the orientation-dependent Raman spectra of cellulose, whereas the red spectrum represents hexane extractives. The distribution of these three compounds on the analyzed sample area is shown in the color-coded Raman image in Fig. 3b. The white rectangle in Fig. 3b marks the area that was imaged in AFM AC mode. Fig. 3c shows the topography image of a fiber bundle consisting of small, oriented fibrils, characteristic for cellulose fibers. The simultaneously recorded AFM phase image (Fig. 3d) reveals in the central part an additional contrast which can be attributed to the hexane extractive. High-resolution AFM AC images recorded from this region are shown in Figs. 3e (topography image) and 3f (phase image). The hexane extractives show a clear contrast in the phase image, revealing a material with different mechanical properties than the cellulose fibrils underneath.
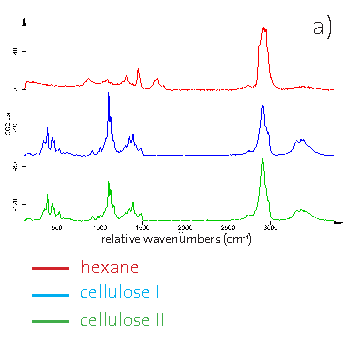
Fig. 3 — Confocal Raman AFM images of traces of wood extractives on cellulose fibers: Raman spectra of cellulose (green and blue spectrum) and hexane extract (red spectrum) (a), color-coded Raman image of a cellulose fiber, image area 20x40 µm², 80x160 pixels, integration time: 100 ms/spectrum (b), high-resolution AFM topography (c) and phase image (d) of the fiber and zoom-ins (e: topography; f: phase).
Paper Finishing
The pure cellulose paper introduced in the previous section is a yellowish, rough paper, which can hardly be used for writing and printing. To provide a paper surface more suitable for e.g. high-resolution halftone screening, the raw paper is coated with a thin layer of calcium carbonate and other additives. Confocal Raman imaging and AFM can provide valuable information on their distribution and effect as the following examples will illustrate.
Fig. 4a shows an investigation of a calcium carbonate coating on paper. This image was obtained with a laser excitation wavelength of 532 nm and a 40x air objective (NA = 0.6). An area of 150x150 µm² was scanned in Raman spectral imaging mode and an array of 150x150 Raman spectra was recorded with an integration time of 90 ms/spectrum. Red and green in Fig. 4a denote the different orientation of the cellulose fibers, whereas blue shows the distribution of calcium carbonate on the coated paper. In Fig. 4b additional additives used in paper coating were investigated. The confocal Raman image of 50x50 µm² reveals that the coating of this paper sample contains, along with calcium carbonate (blue color), starch grains (red) and a polymer matrix (green). The cellulose is shown in yellow.
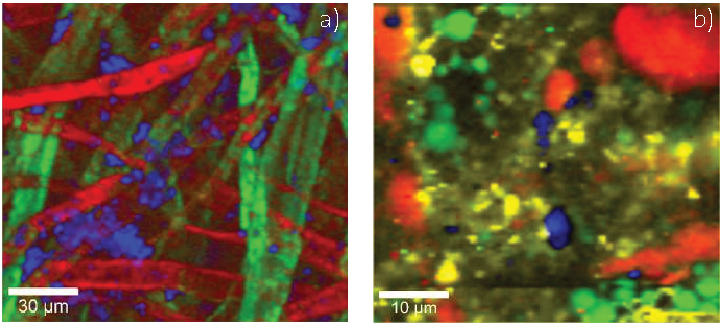
Fig. 4 — (a) The distribution of calcium carbonate (blue) on cellulose paper (red and green color show the different orientations of the cellulose fibers), image area 150x150 µm², 150x150 pixels, integration time: 90 ms/spectrum. (b) The distribution of starch (red), calcium carbonate (blue) and a polymeric material (green) on cellulose paper (yellow), image area 50x50 µm², 100x100 pixels, integration time: 512 ms/spectrum.
AFM can additionally contribute to the analysis of paper finishing with high-resolution images that describe the surface roughness of the paper (Fig. 5). The topography of raw paper is shown in Fig. 5a, revealing the fibrillar fine structure of cellulose fibers with diameters in the nm-range. This surface is rather rough and cannot be used for writing or printing. In Figs. 5b and 5c the topography of laminated paper is shown after applying one and two laminations, respectively. The roughness parameters calculated from these differently processed paper surfaces using the WITec software suite for data analysis and evaluation are summarized in Table 1. From these results it is evident that at least two layers of lamination should be applied in order to decrease the surface roughness. The combined Raman-AFM studies give insight into the chemical nature of the additives and laminates as well as their effect on the surface roughness.
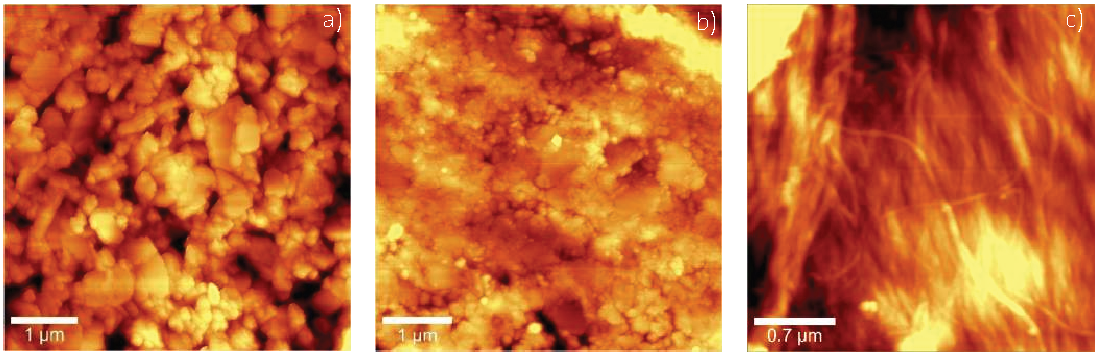
Fig. 5 — High-resolution AFM images of untreated paper (a) and laminated paper after applying one layer (b) and two layers (c).
| Parameter | Raw Paper | One Layer | Two Layers |
| Analyzed area | 27 µm² | 27 µm² | 25 µm² |
| True area | 29 µm² | 34 µm² | 26 µm² |
| Peak-peak | 378 nm | 494 nm | 194 nm |
| Roughness surface average (SA) | 35 nm | 39 nm | 12 nm |
| Roughness mean square (SQ) | 47 nm | 50 nm | 16 nm |
Paper Coating
Depending on the final application of the paper, its coating can consist of several layers with different chemical compositions. Confocal Raman imaging can contribute to the analysis of paper layers in a nondestructive way. Fig. 6 shows a depth scan (x-z scan) obtained from multi-colored paper. An area of 60x100 µm² was scanned in the x-z plane and an array of 100x250 Raman spectra was recorded with an integration time of 50 ms/spectrum. This experiment was performed using an excitation laser wavelength of 532 nm and an oil immersion objective (NA = 1.25). The distribution of the various materials in the layers can be clearly determined and imaged as shown in Fig. 6 (information about the chemical composition remains undisclosed due to confidentiality). The image clearly reveals the presence of 10 different layers along a depth of 100 µm. Most of the coatings used form a well-defined interface without penetrating into one another.
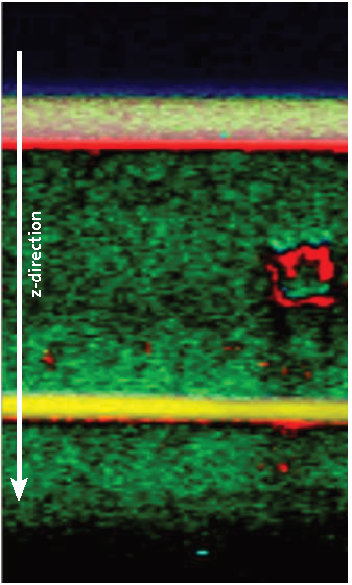
Fig. 6 — Depth scan through a multilayer coating of a paper sample. Different colors in the image represent different coating materials. Image area 60x100 µm², 100x250 pixels, integration time: 50 ms/spectrum.
Another example of modified paper is shown in Fig. 7. Two adhesives were applied to the paper surface to produce a sticky paper label. In this experiment an area of 50x40 µm² was scanned in the x-z plane and an array of 100x80 Raman spectra was acquired with an integration time of 100 ms/spectrum. The measurements were performed with an excitation laser wavelength of 532 nm and an air objective (NA = 0.9). Fig. 7a shows the unique Raman spectra of the two polymers (red and green) and the characteristic Raman spectra of cellulose (blue) and calcium carbonate (orange). The color-coded depth profile (Fig. 7b) shows that the two polymers are sharply distinguishable (red and green) from one another as well as from the paper beneath (blue and yellow).
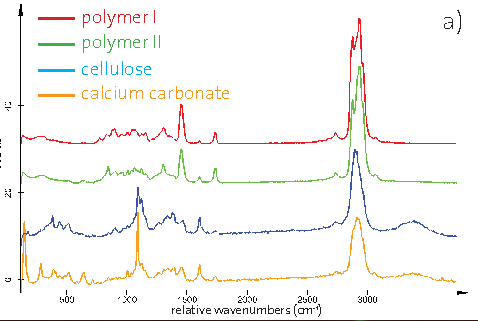
Fig. 7 — Confocal Raman depth scan through a paper sticker. (a) Raman spectra calculated from the spectral array. (b) Color-coded Raman image of depth profile showing the two polymeric layers (red and green) applied on paper (yellow and blue). Image area 50x40 µm², 100x80 pixels, integration time: 100 ms/spectrum.
Writing and Printing on Paper
Confocal Raman imaging can also provide information about the qualities of inks applied on paper. Fig. 8a shows a video image recorded at the intersection of two different inks. The area marked with the red frame (50x50 µm²) was scanned in Raman spectral imaging mode by recording an array of 128x128 complete Raman spectra with an integration time of 100 ms/spectrum. From the array of spectra, three different Raman spectra were calculated. At some surface areas only luminescence could be detected (not shown as a spectrum), whereas other areas showed the unique Raman spectra presented in Fig. 8b. These two spectra show only very small differences of which some are highlighted with arrows in the figure. In the color-coded Raman image presented in Fig. 8c, blue denotes the luminescent areas while the distribution of the two inks are represented in red and green. An area where both inks overlap is clearly visible. The order in which these inks were applied to the paper can be examined with a depth scan (x-z scan), performed along the black line in the video image (Fig. 8a).
An array of 128x128 complete Raman spectra was acquired over 90 µm in the x-direction and 50 µm in the z-direction with an integration time of 100 ms/spectrum. The distribution along the depth profile of the inks is shown in Fig. 8d, using the same color-code as Fig. 8c. This depth profile clearly shows that the red-marked ink was applied on top of the green-marked ink, thus showing the order in which these inks were applied to the paper.
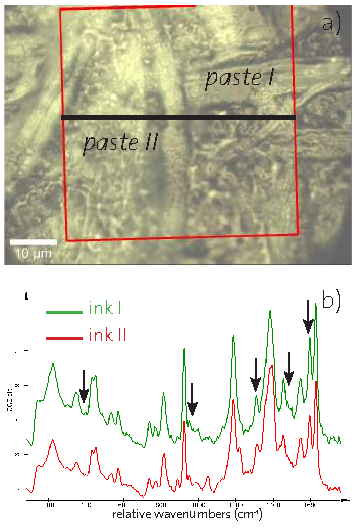
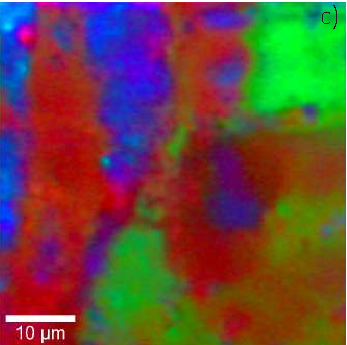
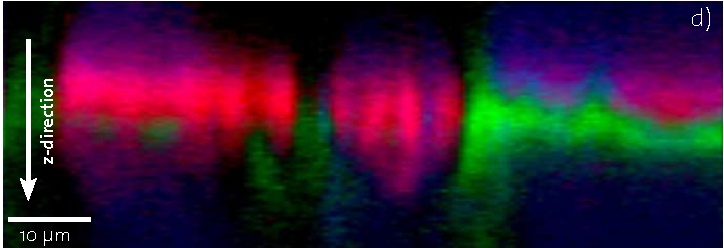
Fig. 8 — Confocal Raman imaging of inks on paper. Video image (a), evaluated Raman spectra (b), color-coded Raman image recorded from the paper surface, image area 50x50 µm², 128x128 pixels, integration time: 100 ms/spectrum (c), and color-coded depth profile, image area 90x50 µm², 128x128 pixels, integration time: 100 ms/spectrum (d). The inks are shown in red and green in the images.
Summary
Confocal Raman imaging and atomic force microscopy can be applied in all steps of paper production and printing to control, examine and improve the process. During the pulping and pressing process confocal Raman imaging can provide information on the orientation of cellulose fibers and several chemical residues from circulating water or wood extractives on cellulose fibers can be identified unambiguously. In further production processes such as finishing and coating, confocal Raman imaging and AFM can reveal valuable information about the distribution of the applied substances and the surface structure. Coating layers can be visualized and investigated with depth scans and the qualities of printing can be described in a non-destructive manner, without laborious sample preparation.
Confocal Raman imaging combined with high resolution AFM contribute to a more detailed understanding of the paper manufacturing process.

