Introduction
The AutoPhaseMap module in the Oxford Instruments' EDS software, AZtecEnergy, automatically finds areas of different characteristic composition from X-ray map data, and determines the distribution, area, constituent elements and composition of each of these areas or phases. This application note examines how this can be used to characterise an aluminium alloy and its inter-metallic phases.
Automatic Phase Mapping and Phase Identification
Aluminium alloys commonly contain intra- and inter-grain metallic inclusions. An SE image (Fig. 1a) of a representative region of this sample suggests at least two of these phases. A spectrum collected from this area indicates the presence of a number of minor elements including copper, iron and manganese in addition to silicon.
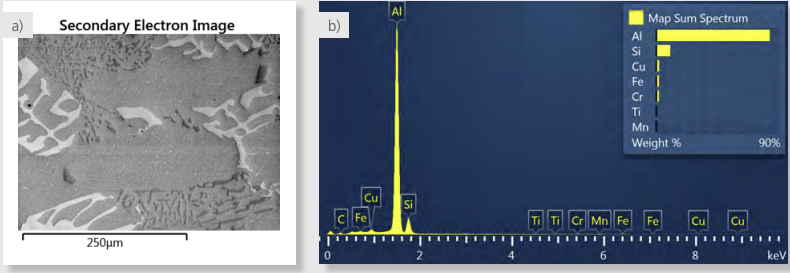
Fig. 1. a) Secondary electron image of area analysed. b) spectrum of the area analysed from the sum of all X-ray data collected during X-ray SmartMap acquisition.
An X-ray SmartMap was collected from an area of the sample under the conditions shown in Table 1 below. A high map resolution and relatively low accelerating voltage were chosen due to the relatively small size of some of the phases (down to 1 μm).
| SEM Type | W Gun |
| Acquisition Time (s) | 2360 |
| Acquisition Rate (cps) | 26000 |
| Accelerating Voltage (kV) | 10 |
| Map resolution | 1024x768 |
| No of pixels | 786423 |
| Counts per pixel | 60 |
Table 1. Acquisition parameters for SmartMap Acquisition.
The X-ray maps were used during acquisition to calculate an AutoPhaseMap image (Fig. 2). This confirmed the presence of three phases including the two inter-metallic phases, but also highlighted a small region where no phase was identified. A spectrum reconstructed from this small region revealed a further constituent element, strontium. This had not been identified previously due to the low kV, scarcity of the phase, and the overlap between Sr L and the more abundant Si K X-rays.
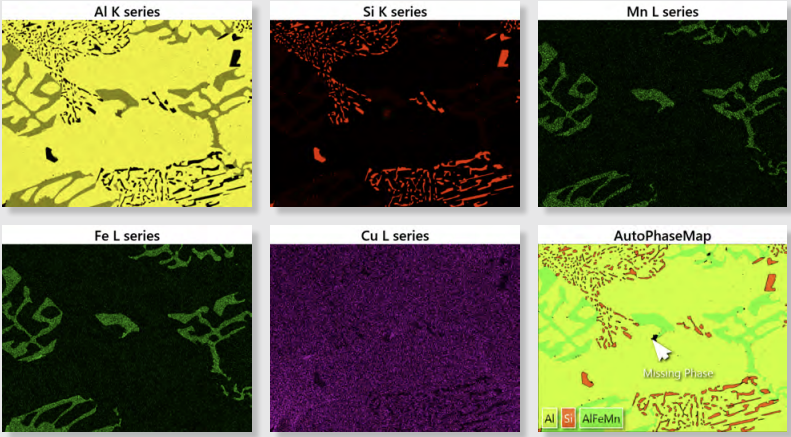
Fig. 2. X-ray maps for the main sample constituent elements and AutoPhaseMap calculated from these maps during acquisition.
Once the Sr L X-ray map (Fig. 3a) was added, and the AutoPhaseMap re-calculated from this modified X-ray map data (Fig. 3b), the micro-structure of the sample is revealed with four phases identified. AutoPhaseMap also presents other information such as the area fraction of each phase (Fig. 3c).
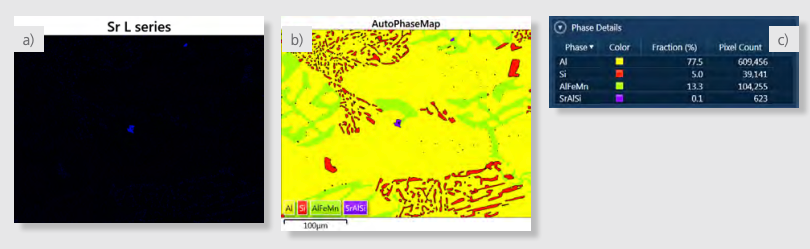
Fig. 3. a) X-ray map for Sr L b) AutoPhaseMap image calculated from the X-ray maps shows the distribution of the phases in the sample. c) Phase details page summarises the phases found and their relative abundance.
In addition, the AutoPhaseMap software displays for each phase: a phase image showing the distribution of the phase, a spectrum calculated by summing the pixels identified as belonging to that phase, and a quantitative result for each phase giving the average phase composition. The results for the phases identified are shown in Fig. 4.
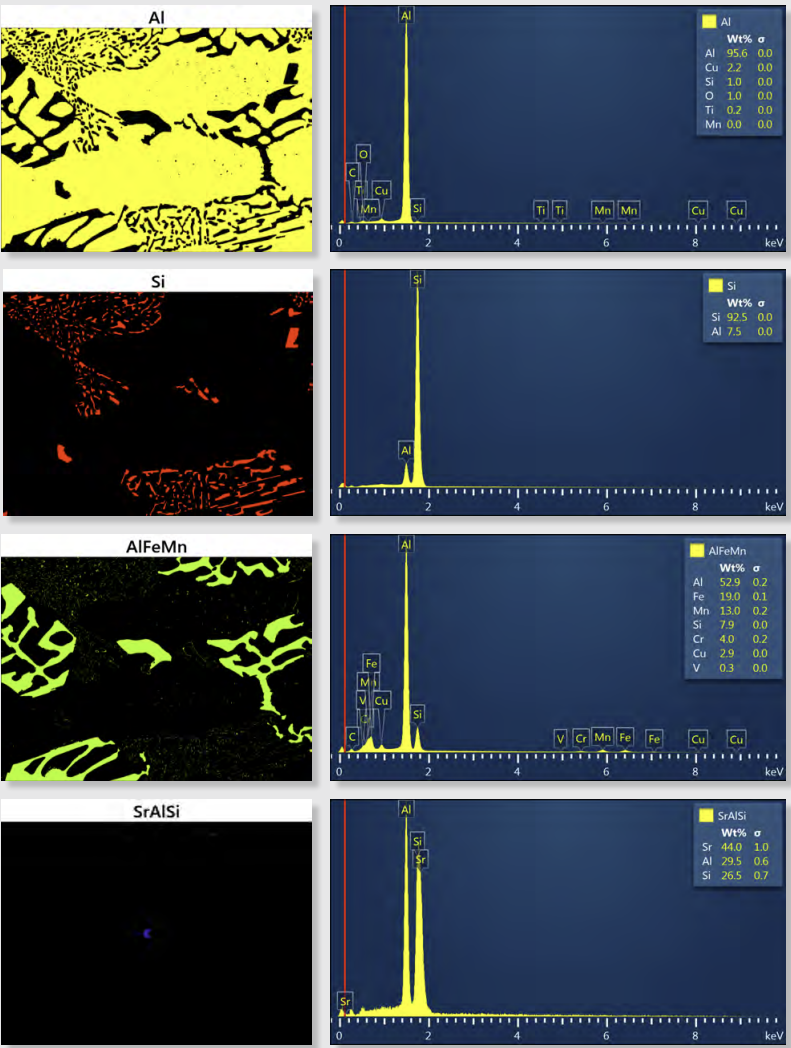
Fig. 4. AutoPhaseMap results for the four phases identified in the aluminium alloy sample.
Conclusion
AutoPhaseMap finds the phases present in a sample based on the X-ray maps constructed from an X-ray SmartMap. The AutoPhaseMap data is calculated in seconds, even for a large dataset with over 700,000 pixels, as used above. This allows AutoPhaseMap to be used in real-time as part of the sample investigation, in addition to being used to analyze the phases in the sample. In this example, a new constituent element and an additional phase were identified with the help of this tool.

