Tissue clearing is a broad term that defines techniques that have the final goal of reducing the opacity of biological tissues to see features deep within a sample while maintaining its original structure. To do that, the sample is treated with a series of chemical solutions that will make it transparent and, when combined with fluorescent staining and advanced imaging methods, it is possible to achieve an unprecedented view of the whole specimen and allow acquisition of detailed information from the intact biological sample.
This Technical Note aims to help researchers select the best clearing protocol for their experiments. We present a comprehensive summary of the most common methods of clearing that have been developed in the past two decades. As such, the note is divided in 3 main points, click on any of those below to navigate to the section of interest:
1. Limitations When Imaging Large Tissues
2. How Does Tissue Clearing Work?
3. Overview of Clearing Methods
4. Which is the best Optimal Tissue Clearing Method For My Application?
Movie 1. Mouse brain sectioned at 600µm thickness and imaged with Dragonfly
Part of a montage of a 10 x 12 array of tiles stitched together, each one containing 237 z-steps, to cover 570 µm in thickness. To prepare the sample, the mouse was injected with Rabies-GFP and Rabies-RFP, the tissue was SHIELD fixed, sectioned at 600um, passively delipidated with SDS, and stained passively with antibodies and DAPI. Imaged with Andor Dragonfly 202, using simultaneous 2 colour imaging with a 10X objective. Image credit: Hong Wei Dong, M.D., Ph.D. Lab at UCLA, Department of Neurobiology.
Limitations When Imaging Large Tissues
The opacity of thick tissue hinders light penetration and makes it almost impossible to obtain well-resolved images. Researchers have traditionally overcome the inability to image deep within tissues by taking a three-dimensional specimen and physically sectioning it into ultra-thin 2D slices. However, this disrupts the integrity of the sample and limits the amount of information that can be collected.
The limit of imaging depth that's imposed by the natural scatter of biological non-cleared samples can vary from 50 to 200um. This means that after 50um the image quality starts to degrade, the background intensity increases and as a result, the contrast (also called signal-to-noise ratio) is reduced. In cleared tissues, on the other hand, the light can traverse millimeters or even centimeters into the tissue unhindered. Now imaging mm or cm deep into tissues is possible. Nevertheless, to be able to visualize those thick samples it is essential to use a confocal microscope, such as Andor Dragonfly (see Movie 1 and Figure 1), which allows rejection of out-of-focus light and delivers high-resolution, 3D images with more contrast. For more information on how to image cleared tissues, see our Solution Note: Imaging Cleared Tissues with Dragonfly Spinning Disk Confocal.
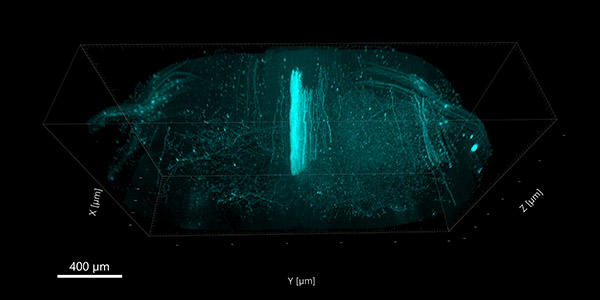
Figure 1. Confocal image of a mouse spinal cord cleared with the iDISCO clearing method.
Montage of a 5x1 array of tiles stitched together, each one containing 2530 z-steps, to cover 1.3 mm in thickness. To prepare the sample, the mouse was injected in the motor cortex with an adeno associated virus that expresses the fluorescent protein tdTomato. After spinal cord collection, the tissue was immunolabeled with a fluorescent antibody that recognizes the fluorescent protein and then cleared. Imaging was performed on an Andor spinning-disk confocal Dragonfly in 1 hour and 15 minutes, with a 25X water-immersion, long working distance objective with a numerical aperture of 0.95. Image credit: Kar Men Mah, Vance Lemmon, and Pantelis Tsoulfas; The Miami Project, University of Miami.
How Does Tissue Clearing Work?
Proteins and lipids that form cells and biological tissues have a high refractive index (RI ~ 1.45-1.47), while cytosol, the aqueous part inside each cell, has a refractive index closer to water (RI = 1.33). When light passes through these regions with different refractive indexes it is diffracted (bent) and adsorbed differently causing the ray to be scattered (dispersed). The more cells in the sample, the greater the amount of light that gets dispersed, making the tissues appear opaque.
The concept behind tissue clearing methods is to equalize the Refractive Index of all the components inside the cells so that the light can pass through the whole sample undisturbed (Figure 2).
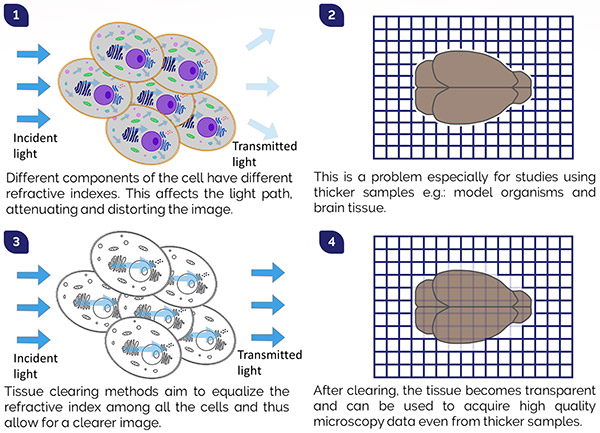
Figure 2. Tissue Clearing Process
1) Differences in refractive indices inside the cells cause the scattering of light in the tissue. 2) The refractive index mismatch results in tissue opacity, which is a problem when imaging thicker samples (e.g.: whole organs or small model organisms). 3) Tissue clearing reagents aim to reduce light scattering by normalizing the refractive index throughout the tissue so that the light can pass undisturbed. 4) Cleared tissues are transparent and can be imaged in their entirety.
Overview of Clearing Methods
Since the development of the first modern method to clear tissues in 2007 [1], there has been a proliferation of new clearing protocols, each with its own unique advantages and disadvantages. To help researchers to navigate the literature and decide which technique will work best to answer their research questions we list the most common clearing methods, highlighting their main characteristics. There are three primary approaches to make biological tissues transparent:
- Organic solvent-based (also called hydrophobic or high refractive index matching techniques)
- Aqueous and hyper-hydrating
- Hydrogel-embedding
1. Organic solvent-based tissue clearing
Organic solvent-based methods generally require dehydration followed by lipid removal and refractive index matching steps (Figure 3). The protocols are rapid and robust in clearing tissues but tend to shrink the samples and are unsuitable for lipid studies. They are compatible with immunostaining but tend to quench fluorescent proteins and require additional signal amplification steps.
A major disadvantage of these protocols is that the BABB solution (which is used in all of them) is very toxic for humans and if in contact with microscope equipment (e.g.: objectives) it will severely damage it.
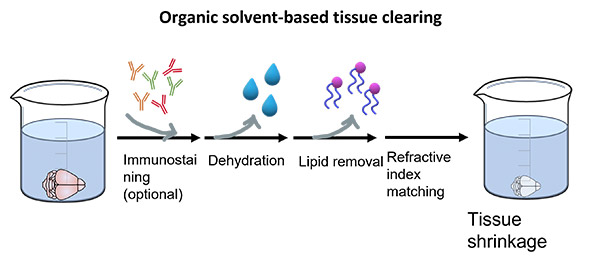
Figure 3
2. Aqueous hyper-hydrating tissue clearing
Aqueous hyper-hydrating protocols such as CUBIC, Scale, SeeDB, allow better retention of endogenous signals but the clearing is limited to smaller samples and requires a longer time to achieve complete transparency. Moreover, upon clearing with aqueous hyper-hydrating agents, the samples tend to expand (Figure 4). The main advantage is that these methods are much less hazardous compared to all the other clearing protocols and generally compatible with immunostaining and fluorescent proteins.
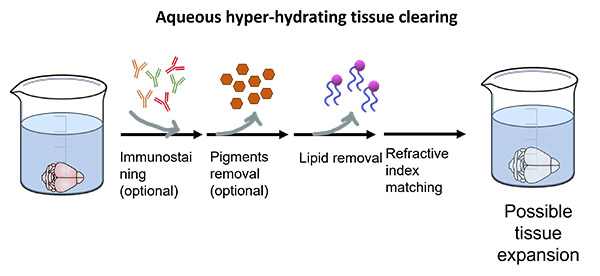 Figure 4
3. Hydrogel-embedding tissue clearing
Hydrogel-embedding techniques generate cross-links between the proteins to create firm scaffolds to avoid damage of the tissue structure. To achieve this, the sample is embedded in hydrogel and only after it is immersed in strong detergents to remove the lipids, followed by refractive index matching (Figure 5). These methods are technically more difficult and sometimes require an electrophoresis step to accelerate the clearing process and increase the penetration of antibodies. These techniques efficiently preserve the proteins in the sample, as well as RNA and DNA, making them ideal for multiplexed labelling and fluorescent in-situ hybridization (FISH) studies. The most common protocols of this type are CLARITY, PACT, PARS, and SHIELD.
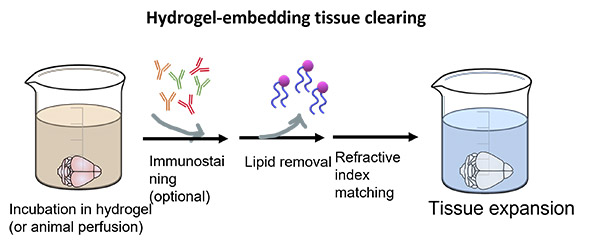 Figure 5
Which is the Best Optimal Tissue Clearing Method For My Application?
With the proliferation of multiple tissue clearing methods, it is challenging to choose the most appropriate method when starting this technical approach. Table 1 aims to be a guide in to help you choose where begin. Nevertheless, researchers should remember that each sample and application will always require hands-on optimization, so please use the table as a starting guide.
Once the samples are cleared, and the tissue is stained, the next step is to image the large, cleared samples. There are several requirements that a microscope needs to have to be an ideal system for such a task. Among others, the microscope should allow deep and fast imaging and deliver high background rejection with an excellent signal-to-noise ratio. Read our solution note to find why Andor Dragonfly is the ideal system to image cleared samples.
| Method Type |
Method Name |
Immunostaining |
Fluorescent Proteins |
Protocol Time |
Morphology |
Tissue Size |
Refractive Index |
References |
| Hydrophobic (solvent-based) |
BABB |
Yes |
No |
Days |
Shrinkage |
Young mouse brain |
1.55 |
3 |
| 3DISCO |
Limited |
Yes |
Hours/Days |
Shrinkage |
Adult mouse brain |
1.56 |
1 |
| iDISCO(+) |
Yes |
No |
Hours/Days |
Shrinkage |
Adult mouse brain |
1.56 |
2 (4) |
| uDISCO |
Yes |
No |
Hours |
Shrinkage |
Whole adult mouse |
1.56 |
5 |
| vDISCO |
Yes |
No |
Hours |
Shrinkage |
Whole adult mouse |
1.56 |
6 |
| Aqueous (water-based) |
Scale AS (S) |
Yes |
Yes |
Days |
Expansion (Preserved) |
Mouse embryo |
1.38 |
7 (8) |
| SeeDB |
No |
Yes |
Days |
Preserved |
Mouse Brain |
1.48 |
9 |
| CUBIC |
Yes |
Yes |
Days |
Expansion |
Max 1-2 mm tissues |
1.47 |
10 |
| ClearT |
Yes |
No |
Hours/Days |
Preserved |
Mouse embryo |
1.44 |
11 |
| Hydrogel embedding |
CLARITY |
Yes |
Yes |
Days/Weeks |
Expansion |
Whole mouse brain |
1.45 |
12 |
| PACT (PARS) |
Yes |
Yes |
Days |
Small Expansion (Preserved) |
Whole adult mouse |
1.38 - 1.48 |
12 (13) |
| SHIELD |
Yes |
Yes |
Days |
Preserved |
Up to 5 mm |
1.45 |
14 |
Table 1: Summary of the most common tissue clearing techniques.
References
1. Erturk A, Becker K, Jahrling N, Mauch CP, Hojer CD, Egen JG, Hellal F, Bradke F, Sheng M, Dodt HU. Three-dimensional imaging of solvent-cleared organs using 3DISCO. Nature protocols. 2012a; 7:1983-1995.
2. Renier N, Wu Z, Simon DJ, Yang J, Ariel P, Tessier-Lavigne M. iDISCO: a simple, rapid method to immunolabel large tissue samples for volume imaging. Cell. 2014; 159:896-910.
3. Dodt HU, Leischner U, Schierloh A, Jahrling N, Mauch CP, Deininger K, Deussing JM, Eder M, Zieglgansberger W, Becker K. Ultramicroscopy: three-dimensional visualization of neuronal networks in the whole mouse brain. Nature methods. 2007; 4:331-336
4. Renier, N., Adams, E. L., Kirst, C., Wu, Z., Azevedo, R., Kohl, J., et al. Mapping of brain activity by automated volume analysis of immediate early genes. Cell. 2016; 165, 1789-1802.
5. Pan, C., Cai, R., Quacquarelli, F. P., Ghasemigharagoz, A., Lourbopoulos, A., Matryba, P., et al. Shrinkage-mediated imaging of entire organs and organisms using uDISCO. Nature Methods. 2016; 13, 859-867.
6. Cai, R., Pan, C., Ghasemigharagoz, A. et al. Panoptic imaging of transparent mice reveals whole-body neuronal projections and skull-meninges connections. Nat Neuroscience. 2019; 22, 317-327.
7. Hama H, Kurokawa H, Kawano H, Ando R, Shimogori T, Noda H, Fukami K, Sakaue-Sawano A, Miyawaki A. Scale: a chemical approach for fluorescence imaging and reconstruction of transparent mouse brain. Nature neuroscience. 2011; 14:1481-1488.
8. Hama H, Hioki H, Namiki K, Hoshida T, Kurokawa H, Ishidate F, Kaneko T, Akagi T, Saito T, Saido T, Miyawaki A. ScaleS: an optical clearing palette for biological imaging. Nature Neuroscience. 2015; 18(10):1518-29.
9. Ke MT, Fujimoto S, Imai T. SeeDB: a simple and morphology-preserving optical clearing agent for neuronal circuit reconstruction. Nature neuroscience. 2013; 16:1154-1161.
10. Susaki EA, Tainaka K, Perrin D, Kishino F, Tawara T, Watanabe TM, Yokoyama C, Onoe H, Eguchi M, Yamaguchi S, et al. Whole-brain imaging with single-cell resolution using chemical cocktails and computational analysis. Cell. 2014; 157:726-739.
11. Kuwajima T, Sitko AA, Bhansali P, Jurgens C, Guido W, Mason C. ClearT: a detergent-and solvent-free clearing method for neuronal and non-neuronal tissue. Development. 2013; 140:1364-1368
12. Chung K, Wallace J, Kim SY, Kalyanasundaram S, Andalman AS, Davidson TJ, Mirzabekov JJ, Zalocusky KA, Mattis J, Denisin AK, et al. Structural and molecular interrogation of intact biological systems. Nature. 2013; 497:332-337
13. Yang B, Treweek JB, Kulkarni RP, Deverman BE, Chen CK, Lubeck E, Shah S, Cai L, Gradinaru V. Single-Cell Phenotyping within Transparent Intact Tissue through Whole-Body Clearing. Cell. 2014; 158:945-958.
14. Park, YG., Sohn, C., Chen, R. et al. Protection of tissue physicochemical properties using polyfunctional crosslinkers. Nat Biotechnol. 2019; 37, 73-83