Application Notes
NMR log calibration from laboratory core measurements
Published: 03 Nov 2026 · Last updated: 03 Nov 2026
This Application Note was created in collaboration with Green Imaging Technologies

Introduction
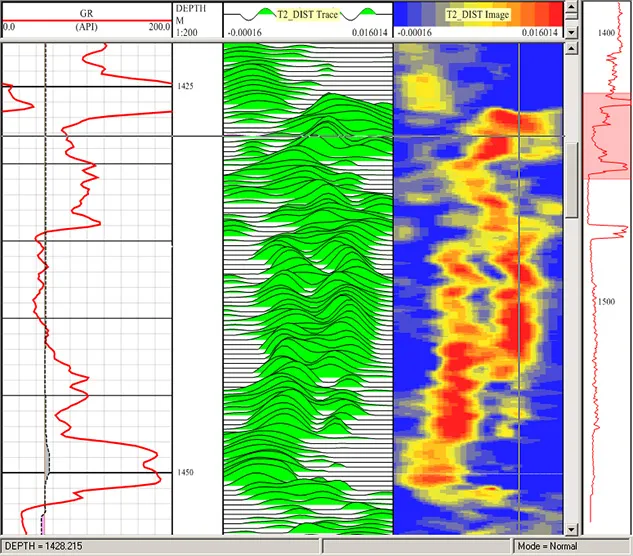
The fundamental basis of Nuclear Magnetic Resonance (NMR) measurements on fluid-bearing rocks is that the decay or relaxation time of the NMR signals (T2) is directly related to the pore size. The NMR signal detected from a fluid-bearing rock therefore contains T2 components from every different pore size in the measured volume. Using a mathematical process known as inversion, these components can be extracted from the total NMR signal to form a T2 spectrum or T2 distribution, which is effectively a pore size distribution. From this distribution, various petrophysical parameters such as porosity, permeability, and free and bound fluid ratios can be measured or inferred.
Method
However, as might be expected, things are not quite so simple in practice. The T2 distributions calculated from NMR signals depend on many other parameters besides simply the sizes of the fluid-containing pores. Other factors that influence the shape of the distributions include: the nature of the fluid (in particular the viscosity); the spacing between the data points (echoes) in the NMR signal; the logging speed; the wettability of the rock; and the hydrogen index of the fluid(s) being observed. The variability of these factors in the natural environment can lead to errors in interpreting the logging information collected during the exploration process.
In the laboratory, most of these additional factors can be eliminated or at least controlled by making measurements on fully saturated core samples and on ones that are at irreducible water saturation.
These measurements help to distinguish between fluid and pore size effects. In the logs, these effects have a significant influence on the recorded data making interpretation difficult. Calibration of logs refers to comparing data from the logs with data from well characterised core plugs taken from the same well, in an attempt to make interpretation of the log data easier and more accurate. The value of this process is recognised by logging experts:
"...careful calibration of petrophysical interpretation models with core data is essential for obtaining accurate permeability and bound fluid answers from NMR logs, as compared to using default parameters in the petrophysical model." Schlumberger leaflet on NMR core analysis
What factors can be calibrated?
The two NMR log measurements most often calibrated using core plugs are the T2 cut-off dividing the bound and free fluid, and permeability modelling coefficients.
T2 cut-off
The so-called "T2 cut-off" in a T2 distribution is the T2 value that divides the small pores that are unlikely to be producible from the larger pores that are likely to contain free fluid. The integral of the distribution above the T2 cut-off is a measure of the free fluid (mobile fluid) in the rock, and is clearly influenced by the position of the T2 cut-off point, as shown in Figure 1. The portion of the curve below the cut-off is known as bound fluid and is made up of the clay bound fluid and the capillary bound fluid.
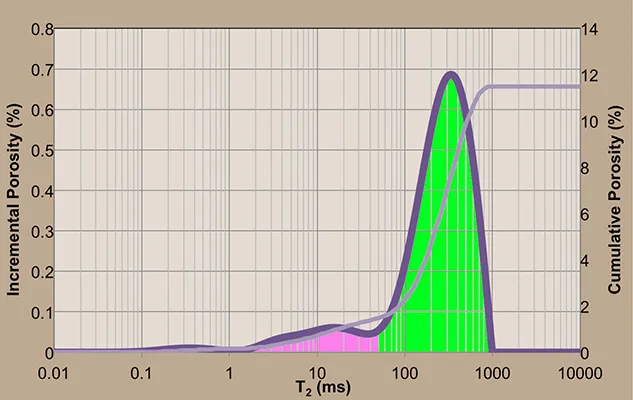
Fig. 1 — T2 distribution showing integral for free fluid
An accurate determination of the T2 cut-off point is essential for an accurate determination of recoverable reserves (mobile fluid). T2 cut-off can be easily determined in the laboratory by using two NMR measurements; one on a cleaned and re-saturated plug, the other on the same plug after it has been spun in a centrifuge to irreducible water saturation.
T2 distributions are plotted for both data sets, along with the cumulative values of the distributions. The T2 cut-off is taken to be the point at which the cumulative value of the saturated distribution (blue horizontal arrow in Figure 2) equals the final cumulative value of the irreducible distribution (vertical blue arrow in Figure 2). The data plotting and calculation for this measurement are carried out automatically by the LithoMetrix software supplied as standard with every GeoSpec NMR core analyser.
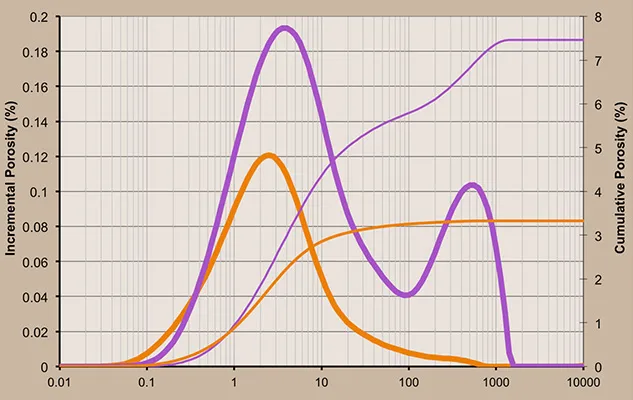
Fig. 2 — T2 distributions showing T2 cut-off point
This measurement should be done on core plugs taken from various zones in the well, with the resulting T2 cut-off values applied retrospectively to the log data from each depth. This will result in a more accurate prediction of Bound Volume Index (BVI) and Free Fluid Index (FFI) than those obtained by applying a single default value of the T2 cut-off to the entire log.
The following example illustrates how reserve estimates can be seriously under-reported if a standard cut-off value is used without laboratory calibration. The samples used in this study were from a tight sandstone play.
In this particular example, laboratory measurements correct the standard cut-off estimate of free fluid index by an average of 260%. This means that this reserve could produce 2.6 times more oil than would have been estimated if the laboratory calibration had not been completed. See table below and Figure 3.
| Sample | Porosity (%) | Permeability (mD) | FFI at 33msec (%) | Perm. Est. (mD) | Measured FFI (%) | Cut-off (ms) |
| 1 | 5.71 | 0.003 | 0.46 | 0.000068 | 1.34 | 10.00 |
| 2 | 7.59 | 0.003 | 1.04 | 0.000080 | 2.78 | 7.08 |
| 3 | 4.59 | 0.001 | 0.24 | 0.000014 | 0.47 | 14.13 |
| 4 | 7.36 | 0.003 | 1.46 | 0.00170 | 3.13 | 7.94 |
| 5 | 12.01 | 0.28 | 2.71 | 0.045 | 7.88 | 1.79 |
| 6 | 10.03 | 0.22 | 1.51 | 0.004 | 2.42 | 10.66 |
| 7 | 10.2 | 0.13 | 2.00 | 0.032 | 4.42 | 7.77 |
| 8 | 8.8 | 0.15 | 1.17 | 0.031 | 5.08 | 2.66 |
Permeability
Permeability can be calculated from the T2 distribution data using one of two commonly accepted mathematical models: the free-fluid or Coates model (Equation 1) can be applied in formations containing water and/or hydrocarbons, while the average-T2 or Schlumberger model (Equation 2) can be applied to pore systems containing only water and gas. In either case, measurements on core samples are necessary to refine these models by determining the correct values of the coefficients, and produce a model customised for local use.
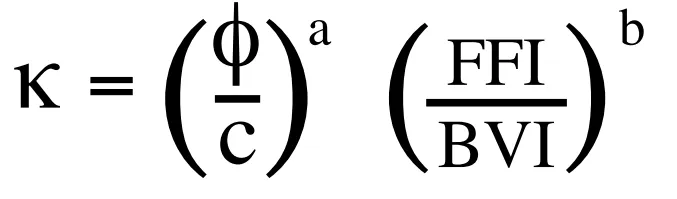
Equation 1 - The Coates model for permeability
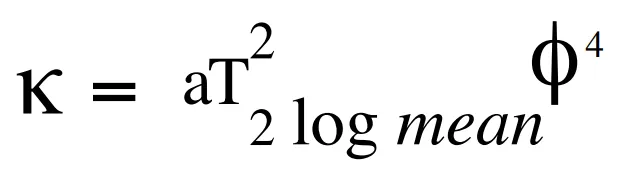
Equation 2 - The Schlumberger model for permeability
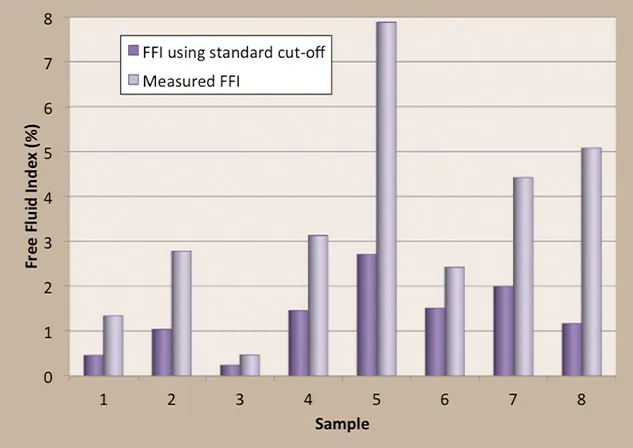
Fig. 3 — Free Fluid Index using standard and measured cut-off values
Customisation of these models is done by inserting values of the log mean T2, FFI and BVI obtained from core plug NMR measurements, and then varying the coefficients until the best linear fit is obtained against permeability measurements determined by other techniques. LithoMetrix (included with every GeoSpec) provides tools to perform this on single samples while the more advanced Green Imaging software packages have advanced regression tools allowing optimum T2 cut-offs and coefficients to be determined for a set of samples. Figure 4 shows NMR permeability derived using these optimised coefficients, versus the actual permeability values for a large set of samples.
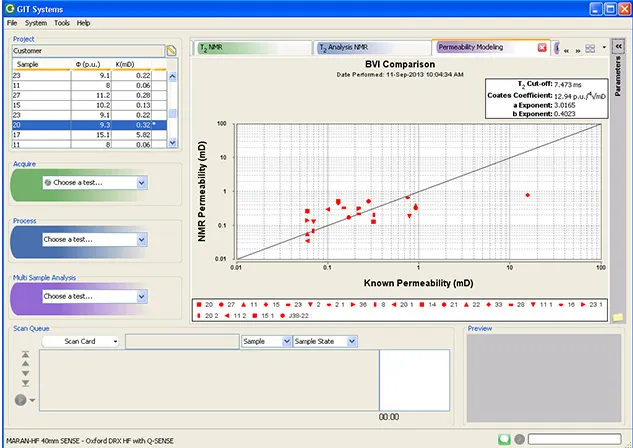
Fig. 4 — NMR permeability versus actual
Necessary apparatus
Tools needed to perform NMR log calibrations as described in this note include: a GeoSpec NMR Core Analyser with LithoMetrix software; a centrifuge capable of removing all mobile (free) fluid from the core plug; and equipment to measure permeability. Although not required to perform log calibrations, pulsed field gradients on the GeoSpec instrument and optional GIT Systems software can allow users to perform additional advanced measurements to further enhance interpretation of NMR logs.
Recommendations for consideration
Expanding our supply of oil and gas requires exploration. With increasing focus on unconventional reserves, it is imperative that we do not rely on previously acceptable "standards" without question. Example after example shows that using standard cut-offs significantly misrepresents reserve estimates. Easy-to-use GeoSpec NMR systems allow rapid, consistent, reliable laboratory measurements to support work completed at the well site; providing reliable results for the reservoir engineers and petrophysicists.