Application Notes
NMR Based Wettability Index for Unconventional Rocks
Published: 03 Nov 2026 · Last updated: 03 Nov 2026
This Application Note was created in collaboration with Green Imaging Technologies

Introduction
In a recent Application Note (Determination of rock core wettability by NMR), we described a method for measuring wettability with NMR. In this App. Note, we describe how this method can be used to track the wettability change in unconventional samples and how this method can overcome some of the challenges inherent in employing traditional wettability determination methods on unconventional samples.
Conventional Methods
Traditional wettability determination methods including the Amott and USBM methods (Morrow et al. (1999)), capture changes in saturations with spontaneous and forced imbibition (displacement). Both methods have had limited success in tight rocks due to difficulties quantifying saturation changes in the small pore volumes present and the limitations of conventional instrumentation, such as a centrifuge used in the USBM test, to reach the pressures required to facilitate incremental forced imbibition (drainage) in nanopores. Alternatively, Amott cells and modified Amott cells have been used in some studies to observe spontaneous imbibition in these rocks and compare differences in uptake rates (Alvarez et al., 2017).
NMR Wettability Index
In this work (as in our previous app note), we have employed an adaptation of Looyestijn's NWI model for rocks (Looyestijn and Hofman, 2006; Looyestijn et al., 2017), which is based on the premise that the NMR T2 spectra of oil- and brine saturated rock samples vary in accordance to changes in the wetting conditions of the samples. One key advantage of its approach over most NMR wettability models is the use of T2 spectra at any saturation level with no requirement for Swi and Sor T2 spectra as input. Another major advantage is its use of complete T2 spectra rather than a single relaxation rate (usually T2 log mean or T2 harmonic mean) for NWI calculations. This enhances the stability and robustness of the method drastically, as minor variations in T2 spectra do not result in major changes in the NWI result, which is often seen with single T2 value-based models.
Consequently, this NWI model is well suited for data sets featuring complex oil and water T2 spectra with multiple peaks as is often observed in unconventional samples.
In our previous application note along with our published paper (Dick et al. 2022), we fully outlined the model we employ to determine the NWI from T2 distributions. As a result, only a brief summary will be presented here. To derive the NWI based on T2 distributions, the NMR T2 spectra of 100% brine saturated sample, 100% oil saturated sample, bulk oil and bulk brine are employed. These spectra are then mixed to give a predicted T2 spectrum which is compared (via a least squares fit) to a T2 spectrum recorded from the sample with mixed water and oil saturation. The results of this fit yield both the wettability index for the sample along with relative oil and water saturations of the sample. The NMR measurements for this wettability study were performed with a 2-MHz GeoSpec 2-75 spectrometer from Oxford Instruments (Geo-Spec 2-75 User Manual). The NMR data acquisition and processing along with the wettability analysis was done using Green Imaging Technologies (GIT) Systems Advanced software package (GIT Systems and LithoMetrix User Manual).
Experimental and Results
The goal of the experiments was to observe the change in the wetting conditions of the varied unconventional samples as a function of time and quantify the steady-state values. Several core plug samples, which spanned various rock types from North American producing unconventional reservoirs, were selected. Twin plugs from each rock type were employed. Spontaneous imbibition was chosen as the actuation method to cause a change in the distribution of wetting fluids in the samples, whereby capillary pressure was the driving force. The small pores inherent to unconventional rocks made other methods of altering the saturations in the samples difficult to employ.
To observe the spontaneous imbibition process, samples saturated with decane were submerged in brine while brine-saturated samples were submerged in decane for prolonged periods of time, on the order of weeks to months. Figure 1 shows water droplets forming on the surface of one of the 100% brine-saturated shale samples after the imbibition of decane. The change in wettability of each fluid/sample combination was monitored over time by acquiring T2 distributions periodically during the imbibition process. These T2 spectra were then employed to derive the NWI and water/oil saturations as the imbibition process continued.
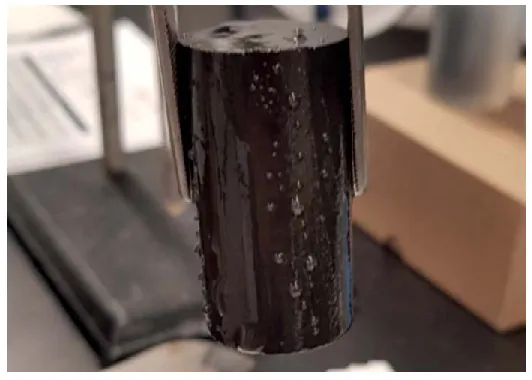
Fig. 1 — Water droplets seen on the surface of an organic-rich marl sample after it had been submerged in decane.
Figure 2 shows the results of the wettability analysis for twins 7-P3A and 7-P2, an organic-rich marl. The wettability change for sample 7-P2 (Figure 2 – left panel – red trace) shows that this sample started off water wet and gradually turned to oil wet over time. By day fifty, the sample reached an NWI of -0.4 and remained near this wettability for the remainder of the experiment. The wettability change for the twin 7-P3A (Figure 2 – left panel – blue trace) shows that this sample started off very oil wet and slowly became less oil wet as the experiment continued. By day fifty, the wettability of this sample stabilized near -0.55. The brine saturation versus elapsed time data trend for each twin (Figure 2 – right panel) showed a shape similar to its corresponding wettability data. For twin 7-P2, the predicted brine saturation (Figure 2 – right panel – red trace) decreased very quickly dropping from near 100% brine saturated to near 30% brine saturated in the first forty days. The saturation was stable near 30% for the remainder of the experiment. For twin 7-P3A, the predicted brine saturation (Figure 2 – right panel – blue trace) increased quickly in the first ten days increasing from less than 10% to near 20% by day twenty. The saturation remained constant at about 20% for the remainder of the experiment.
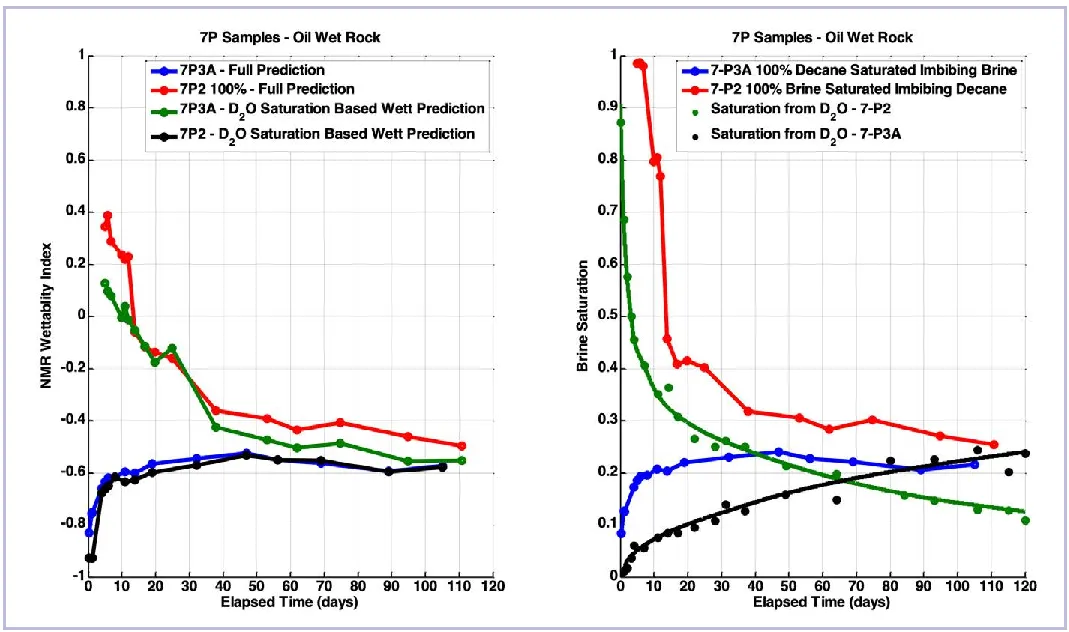
Fig. 2 — The results of the wettability analyses for twins 7-P3A and 7-P2 are shown. The left-hand panel shows the wettability as a function of imbibition time for both samples, while the right-hand panel shows the water saturation as a function of imbibition time for both samples.
To validate the NWI analysis, we dried the samples and saturated them with brine and decane repeating the spontaneous imbibition experiment once again. This time, however, we used deuterated (heavy water, D2O) brine instead of the regular 4% NaCl brine. We are leveraging the fact that D2O behaves chemically no different than H2O yet is physically different and exhibits no NMR signature; hence, during measurements, the NMR spectrometer will only record a signal from the hydrogen atoms in the decane. Conversely, a 100% D2O-saturated sample has no NMR signal. This D2O benchmarking is very helpful as it allows us to determine accurate saturation at any point during the imbibition experiment. This saturation can then be used to check the NWI model saturation independently or to ground the saturation values when using the model.
Fig. 3 shows a typical example of a T2 pore-size distributions measured with both D2O-based (blue trace) and H2O-based (red trace) brines for the same rock at similar saturations. The peak at the lower T2 values in the H2O distribution is due to pores filled mostly with water, while the peak at higher T2 values is due to pores filled with decane. The distribution recorded with D2O-based brine only shows the signal from the decane, so the second peak in the distribution is mostly visible. The first peak intensity has been greatly reduced because decane has not entered the smallest pores.
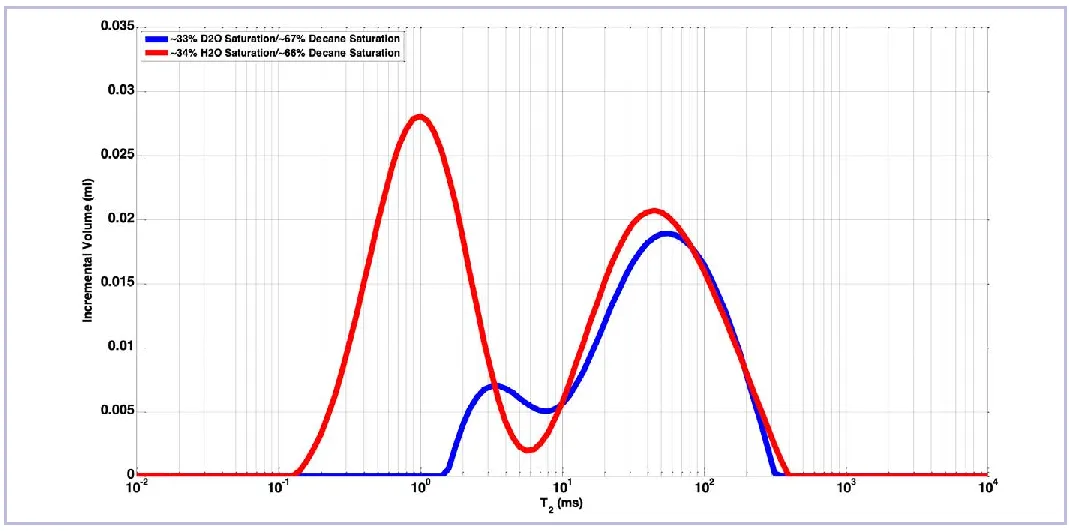
Fig. 3 — Typical example of T2 pore size distributions measured with both D2O (blue trace) and H2O (red trace) based brines for the same rock at similar saturations. The peak at the lower T2 values in the H2O distribution is due to pores filled mostly with water, while the peak at higher T2 values is due to pores filled with decane. The distribution recorded with D2O based brine only shows the signal from the decane so the second peak in the distribution is mostly visible. The first peak intensity has been greatly reduced because decane has not entered the smallest pores.
As seen in the right panel of Figure 2, the brine saturation data derived from the D2O measurements for the 7-P3A/7-P2 twins agreed well with the brine saturations predicted by the NMR wettability analysis. As with the brine saturation for twin 7-P2 predicted from the NMR wettability analysis (Figure 2 – right panel – red trace), the saturation based on the D2O measurements (Figure 2 – right panel – green trace) also dropped very rapidly during the first forty days from 100% to circa 20% before slowing for the remainder of the experiment. The final saturation reached, based on the D2O data for twin 7-P2, was about 10% lower than the final saturation predicted from NMR wettability analysis. For twin 7-P3A, the brine saturation as predicted by the D2O data (Figure 2 – right panel – black trace) showed the same general shape as the brine saturation predicted by the NMR wettability analysis (Figure 4 – right panel – blue trace); however, the brine saturation derived from the D2O data took longer to reach a stable saturation of circa 10%.
Despite the reasonably good agreement between the saturations predicted from the wettability analysis and those derived from the D2O measurements, the wettability for both samples tested were recalculated fixing the saturations at levels computed from the D2O data. For both twins, the wettability derived with the D2O based saturations (Figure 4 – left panel – black and blue traces) agreed very well with the wettability derived from the NMR wettability data. All data indicate that these samples are fairly oil wet.
Conclusions
In this application note we have presented a robust, repeatable, quantitative method for determining sample wettability and water uptake capacity for unconventional samples employing NMR based T2 distributions. This application note has presented the NMR wettability analysis for one unconventional sample (organic-rich marl). For more information on more unconventional samples of varying type (Marl, Chalk, Siltstone) as well as further information on the various measurements completed to validate the NWI method see our previous paper.
References
- Morrow, N. R., Ma, S., Zhou, X., & Zhang, X. (1994, January 1): "Characterization of Wettability from Spontaneous Imbibition Measurements. Annual Technical Meeting", Petroleum Society of Canada. doi:10.2118/94-47
- Alvarez, J. O., Saputra, I. W., & Schechter, D. S. (2017): "The Impact of Surfactant Imbibition and Adsorption for Improving Oil Recovery in the Wolfcamp and Eagle Ford Reservoirs.", Society of Petroleum Engineers Technical Conference and Exhibition. doi: 10.2118/187176-MS.
- Looyestijn, W., Zhang, X., and Hebing, A. (2017): "How can NMR assess the wettability of a chalk reservoir.", Society of Core Analysts Annual Symposium, Vienna, Austria, 27 August–1 September 2017.
- Looyestijn, W.J., and Hofman, J.P. (2006): "Wettability Index Determination by Nuclear Magnetic Resonance", SPE 93624, presented at the MEOS, Bahrain, March 2005. Published in SPEREE April 2006 SPE Reservoir & Engineering
- , pp 1146–153.
- Dick, M. J., Veselinovic, D., Bonnie, R. J. M., Kelly, S. A. (2022) Petrophysics, 63(3). Pages 418–441.
- Geo-Spec 2-75 User Manual, Version 1.8, Oxford Instruments.
- GIT Systems and LithoMetrix User Manual, Revision 1.9, Green Imaging Technologies.