Abstract
Battery electrolyte performance is influenced by the mobility of solvents and charge-carrying ions, which varies with
the molecular identity and is highly dependent on the temperature. This Application Note demonstrates the capabilities
of the Oxford Instruments X-Pulse 90 benchtop NMR spectrometer and pulsed-field-gradient NMR methods to determine
diffusion coefficients for carbonate solvents, [PF₆]− anions and Li⁺ cations in a lithium-ion battery.
Measurements across ¹H, ¹⁹F, ³¹P and ⁷Li nuclei distinguish the transport behaviour of individual electrolyte
components. Variable-temperature NMR measurements quantify the relationship between temperature and diffusion
coefficients, providing insight into electrolyte transport properties under different operating conditions. Together,
these measurements enable component-specific mobility analysis for electrolyte development and battery performance
studies.
Introduction
Lithium-ion (Li-ion) batteries have become ubiquitous in daily life, providing power for a diverse range of
applications, ranging from mobile phones, computers, power tools, and medical devices to the green technologies
including electric cars and solar energy storage. As our usage of lithium-ion batteries has grown, so has the need to
optimise their performance and to ensure reliability over a long lifetime. At the same time new technologies including
sodium-ion (Na-ion) batteries are in development.
Electrolytes play a crucial role in the performance and reliability of Li-ion batteries, providing the medium that
allows anions and cations to carry charge between the electrodes, as shown in Figure 3.1. In the current
generation of commercial batteries, the electrolyte is typically made up of organic small-molecule liquid solvents,
commonly a mixture of alkyl carbonates, combined with a lithium salt. Additionally, various additives are used to
ensure specific chemical and electrochemical properties.
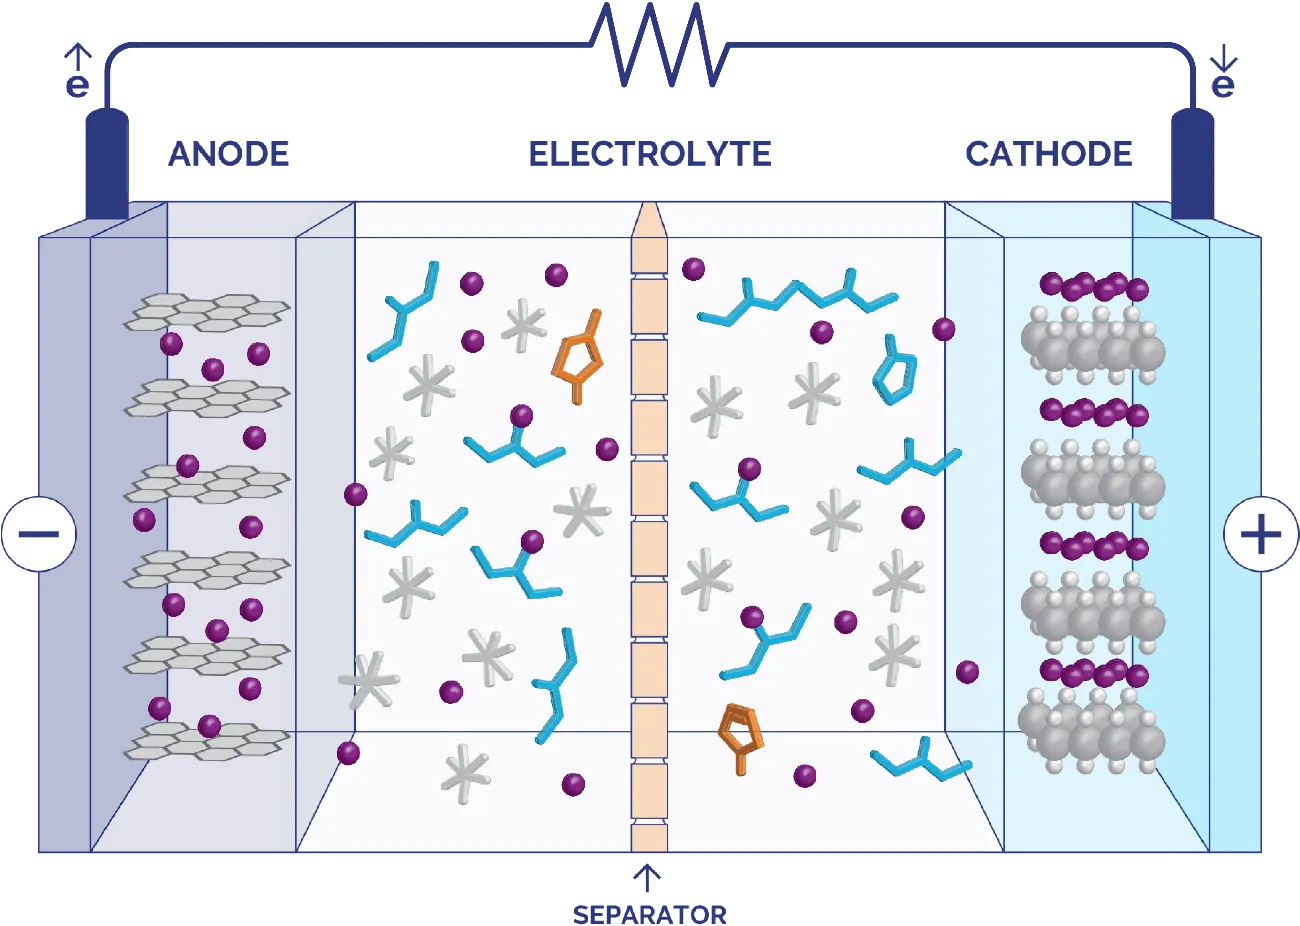
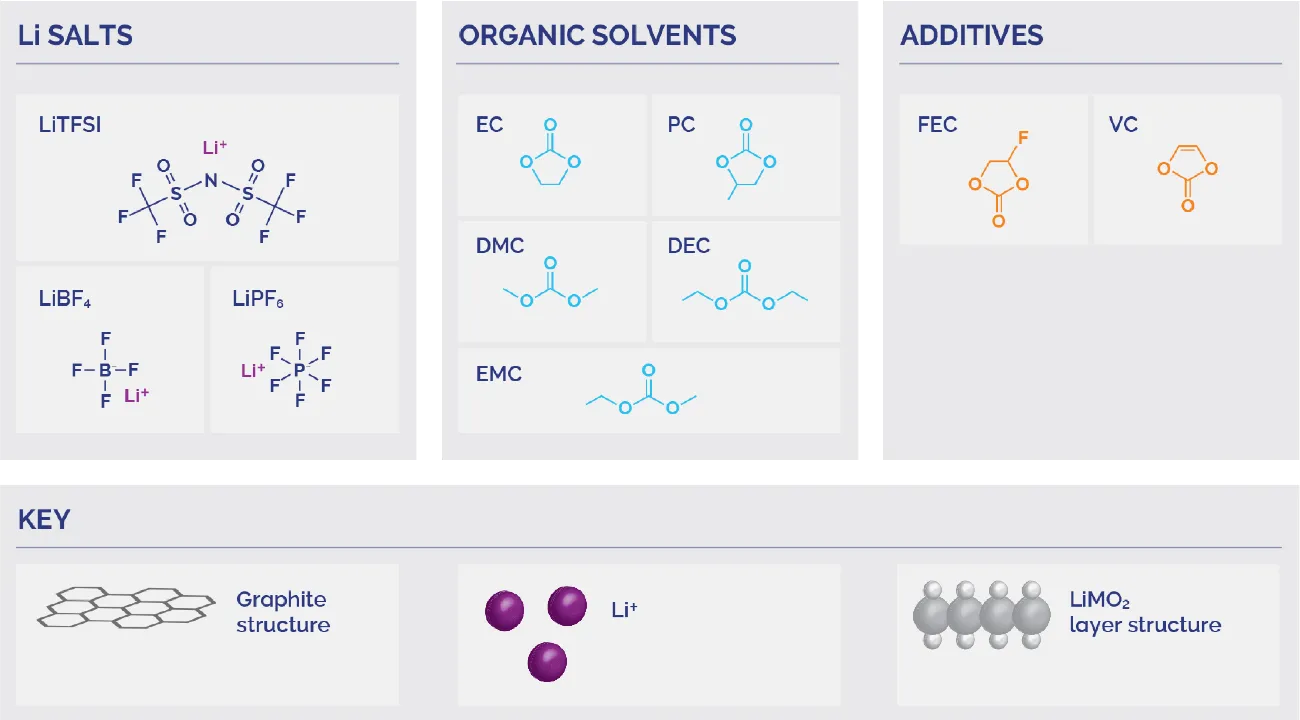
Figure 3.1 Diagram of a lithium-ion battery, showing major components including the
anode, cathode, separator, and electrolyte.
While lithium-ion batteries have played a major role in transforming our daily lives, benchtop NMR spectroscopy has
similarly begun to revolutionise quality assurance and quality control (QA/QC) processes by making a powerful
technique easier and more accessible for routine analysis in any laboratory. Benchtop NMR has many potential
lithium-ion battery QA/QC applications, as the well-resolved spectra of the small organic molecules and ions are
ideally suited for quick, convenient analysis.
The Oxford Instruments X-Pulse broadband benchtop NMR spectrometer (available with a 60
MHz or 90 MHz permanent magnet) provides significant advantages for the development and analysis of battery
electrolytes. Since the X-Pulse comes with ≥50 G/cm pulsed-field gradients as standard, the X-Pulse can be
used to measure diffusion constants on all its supported nuclei, and hence for all the components of a Li-ion (or
Na-ion) battery electrolyte. Accurate measurements of diffusion constants, particularly for the charge carrying
Li-ions and fluorinated anions, are essential to accurately model the electrochemistry of the cell and hence
understand the performance of the battery.
Measuring Diffusion by NMR
Diffusion can be measured by NMR using pulsed-field gradient experiments, most commonly Pulsed field Gradient Spin
Echo (PGSE) (Figure 3.2) or Pulsed Field Gradient STimulated Echo (PFGSTE) (Figure 3.3) pulse
sequences. These encode the position of nuclear spins with a magnetic-field gradient and then attempt to refocus that
magnetisation after a defined diffusion time. Molecules that remain effectively stationary during this interval are
refocused efficiently, whereas molecules that move by translational diffusion experience incomplete refocusing and
therefore show reduced signal intensity.
A diffusion experiment records a series of spectra, usually systematically increasing the gradient strength
(G), while keeping the gradient duration (δ) and diffusion time (Δ) constant. Therefore, each signal is
attenuated according to how rapidly the corresponding molecular species diffuses. The resulting signal attenuation is
fitted using the Stejskal–Tanner equation [1] to obtain the self-diffusion coefficient, D, which can then be
related to properties including molecular size, viscosity, temperature. In battery electrolytes, it can be related to
the mobility of solvent molecules, anions and cations, all of which are important to understand the electrochemical
performance of the battery.

Figure 3.2 Graphical representation of the Pulsed field Gradient Spin Echo (PGSE)
pulse sequence
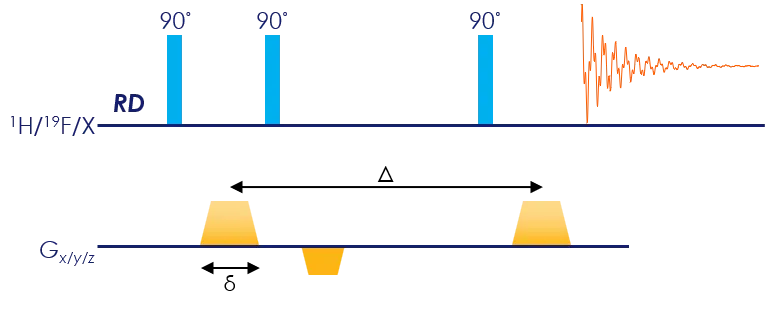
Figure 3.3 Pulsed Field Gradient STimulated Echo (PFGSTE) pulse sequence diagram
The Stejskal–Tanner equation is shown as Equation 3.1:

Equation 3.1 The Stejskal-Tanner equation
where:
- lg is the signal intensity at the applied gradient strength
- lo is the signal intensity with zero applied gradient
- γ is the gyromagnetic ratio
- G is the applied gradient strength
- δ is the gradient duration
- Δ is the diffusion time
Since γ, δ, Δ and D are constants, when plotting the applied gradient strength, G, against the signal intensity (or integral), Ig, the data points can be fitted to the function

The diffusion constant can be calculated from

Example Diffusion Measurements of Battery Electrolyte Components
A sample of Li-ion battery electrolyte, Li[PF6] in EC/DMC/DEC, is used to demonstrate the range of
diffusion measurements possible on a X-Pulse 90 broadband benchtop NMR spectrometer. For these
measurements, either the Pulsed field Gradient Spin Echo (PGSE) or Pulsed Field Gradient STimulated Echo (PFGSTE)
pulse sequence was used, with the gradient strengths varied from 0 up to 58 G/cm.
All these measurements can also be performed on an X-Pulse 60.
Measuring Solvent Diffusion using 1H NMR
To measure diffusion constants of the various compounds in the solvent, a series of 1H PFGSTE spectra were
obtained (Figure 3.4) and the diffusion constants determined (Table 3.1).
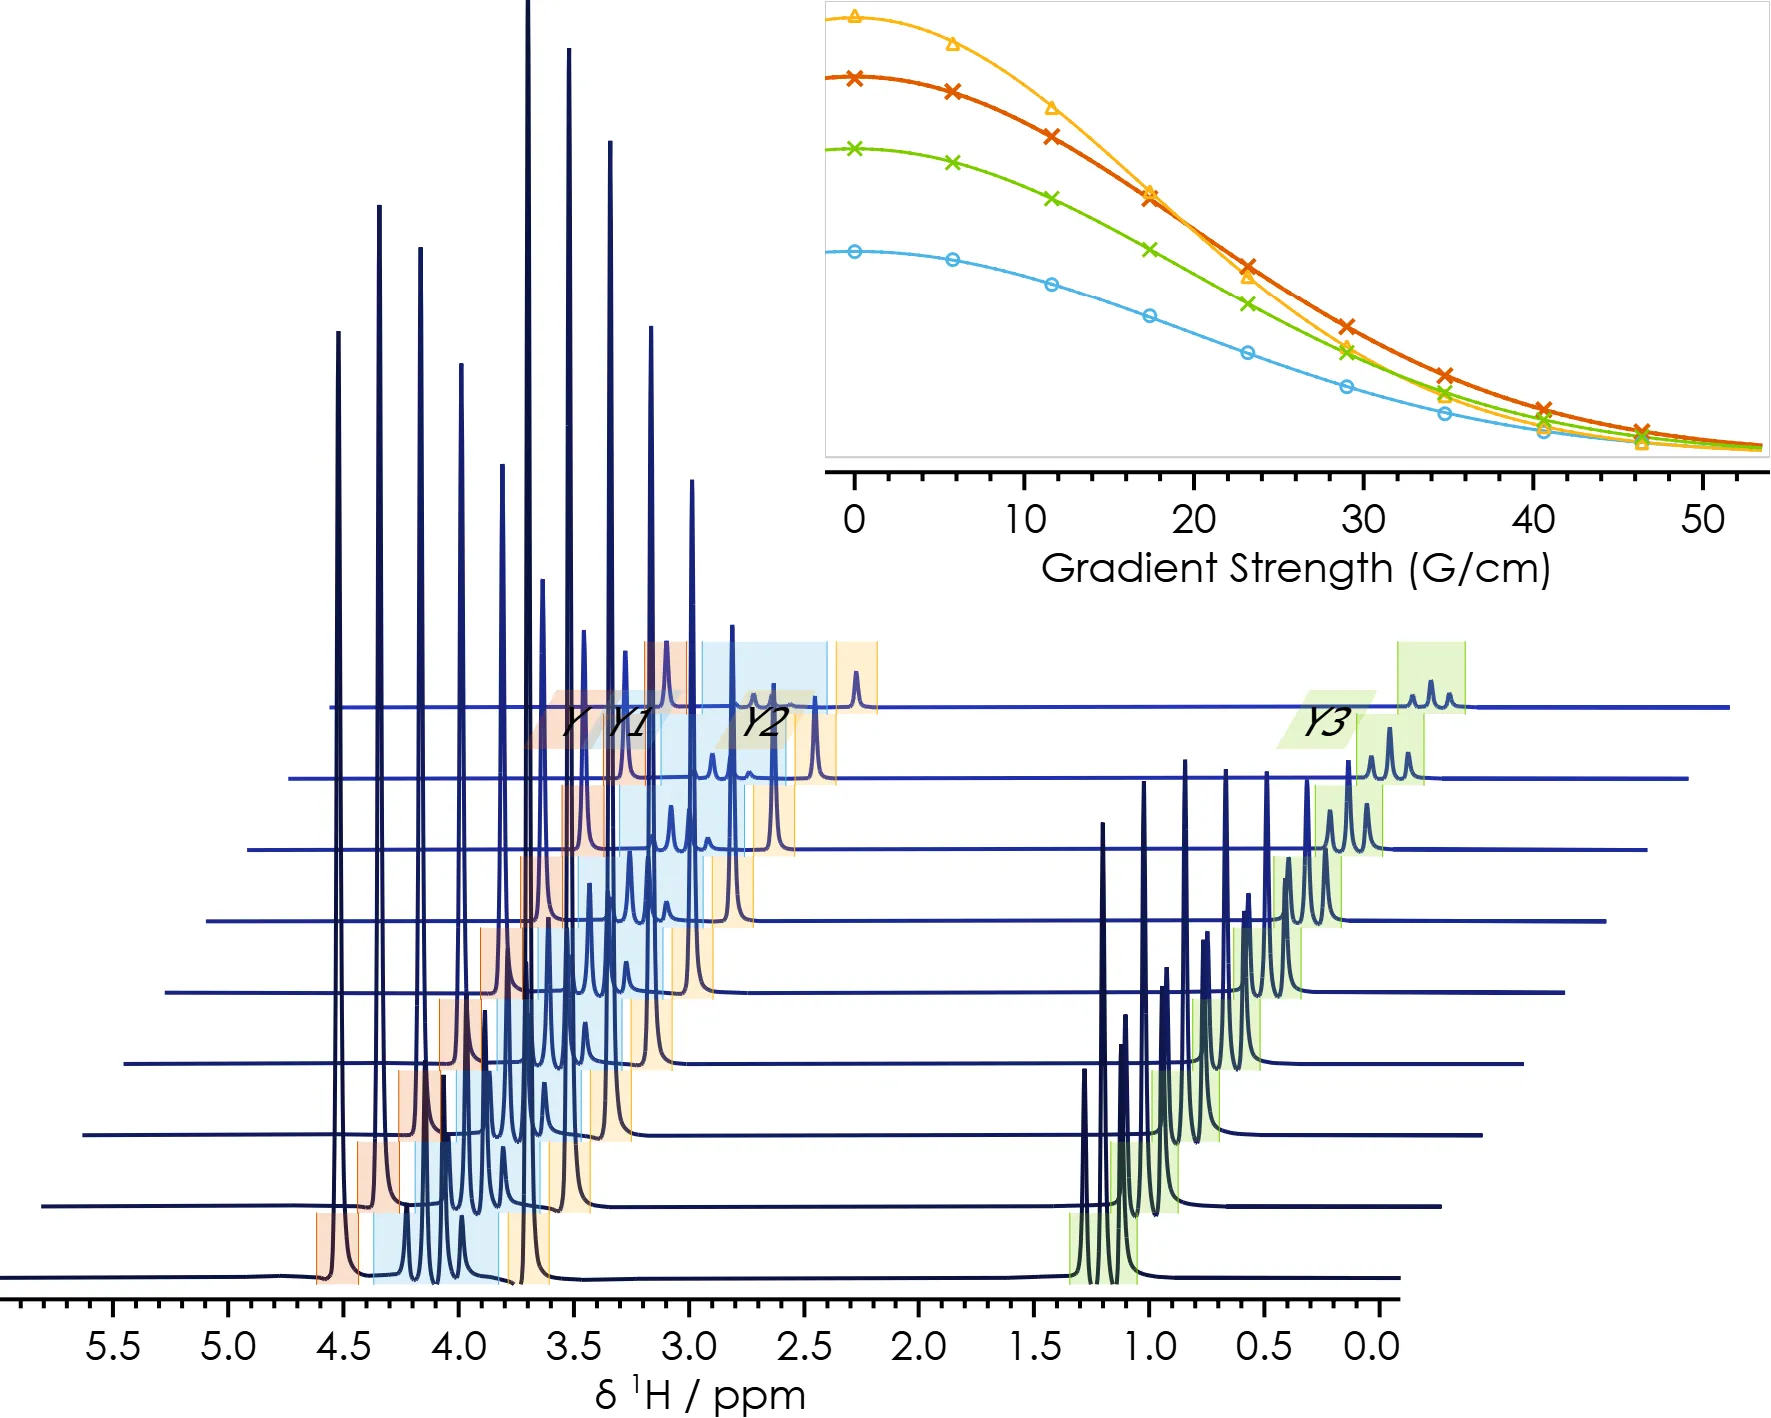
Figure 3.4 1H PFGSTE spectra of Li-ion battery electrolyte
Table 3.1 Diffusion constants determined from 1H PFGSTE
spectra of Li-ion battery electrolyte
|
D / ×10-10 m2/s |
| Ethylene Carbonate (EC) |
7.47 |
| Dimethyl Carbonate (DMC) |
9.66 |
| Diethyl Carbonate (DEC), CH2 |
7.64 |
| Diethyl Carbonate (DEC), CH3 |
7.65 |
These measurements demonstrate an important fact about diffusion. Since diffusion is a molecular
property, it doesn’t matter which signal from a specific molecule is used to determine the diffusion constant. The
result will be the same, as shown by the fact that both the DEC signals have effectively identical diffusion
constants. This fact can also be used to distinguish signals from different compounds in a mixture by determining the
diffusion constant for each signal and matching them up for each molecule. However, this only works if the signals are
clearly distinguished and the molecules reasonably different is size, ensuring a sufficient difference in their
diffusion constants.
Diffusion data can be displayed in various different ways, in addition to stacking the individual one-dimensional
spectra that make up the pseudo -two-dimensional data set (as in Figure 3.4). A common method in to
display it as a two-dimensional DOSY plot, with the chemical shift plotted on the x -axis and the diffusion
constant plotted on the y-axis, as shown in Figure 3.5. The DOSY plot makes it easy to identify
different components in a mixture, but accurately determining the diffusion constants relies on correctly accounting
for the various experimental parameters.

Figure 3.5 1H PFGSTE spectra of Li-ion battery electrolyte,
displayed as a two-dimensional DOSY plot
Measuring [PF6]− Anion Diffusion using 19F & 31P NMR
To determine the diffusion constant of the [PF6]− anion in a Li-ion battery electrolyte, three
data sets were acquired:
- 19F PGSE spectra (Figure 3.6)
- 31P PGSE spectra, without 19F decoupling (Figure 3.7)
- 31P PGSE spectra, with 19F decoupling (Figure 3.8)
The diffusion constant was determined from each data set.
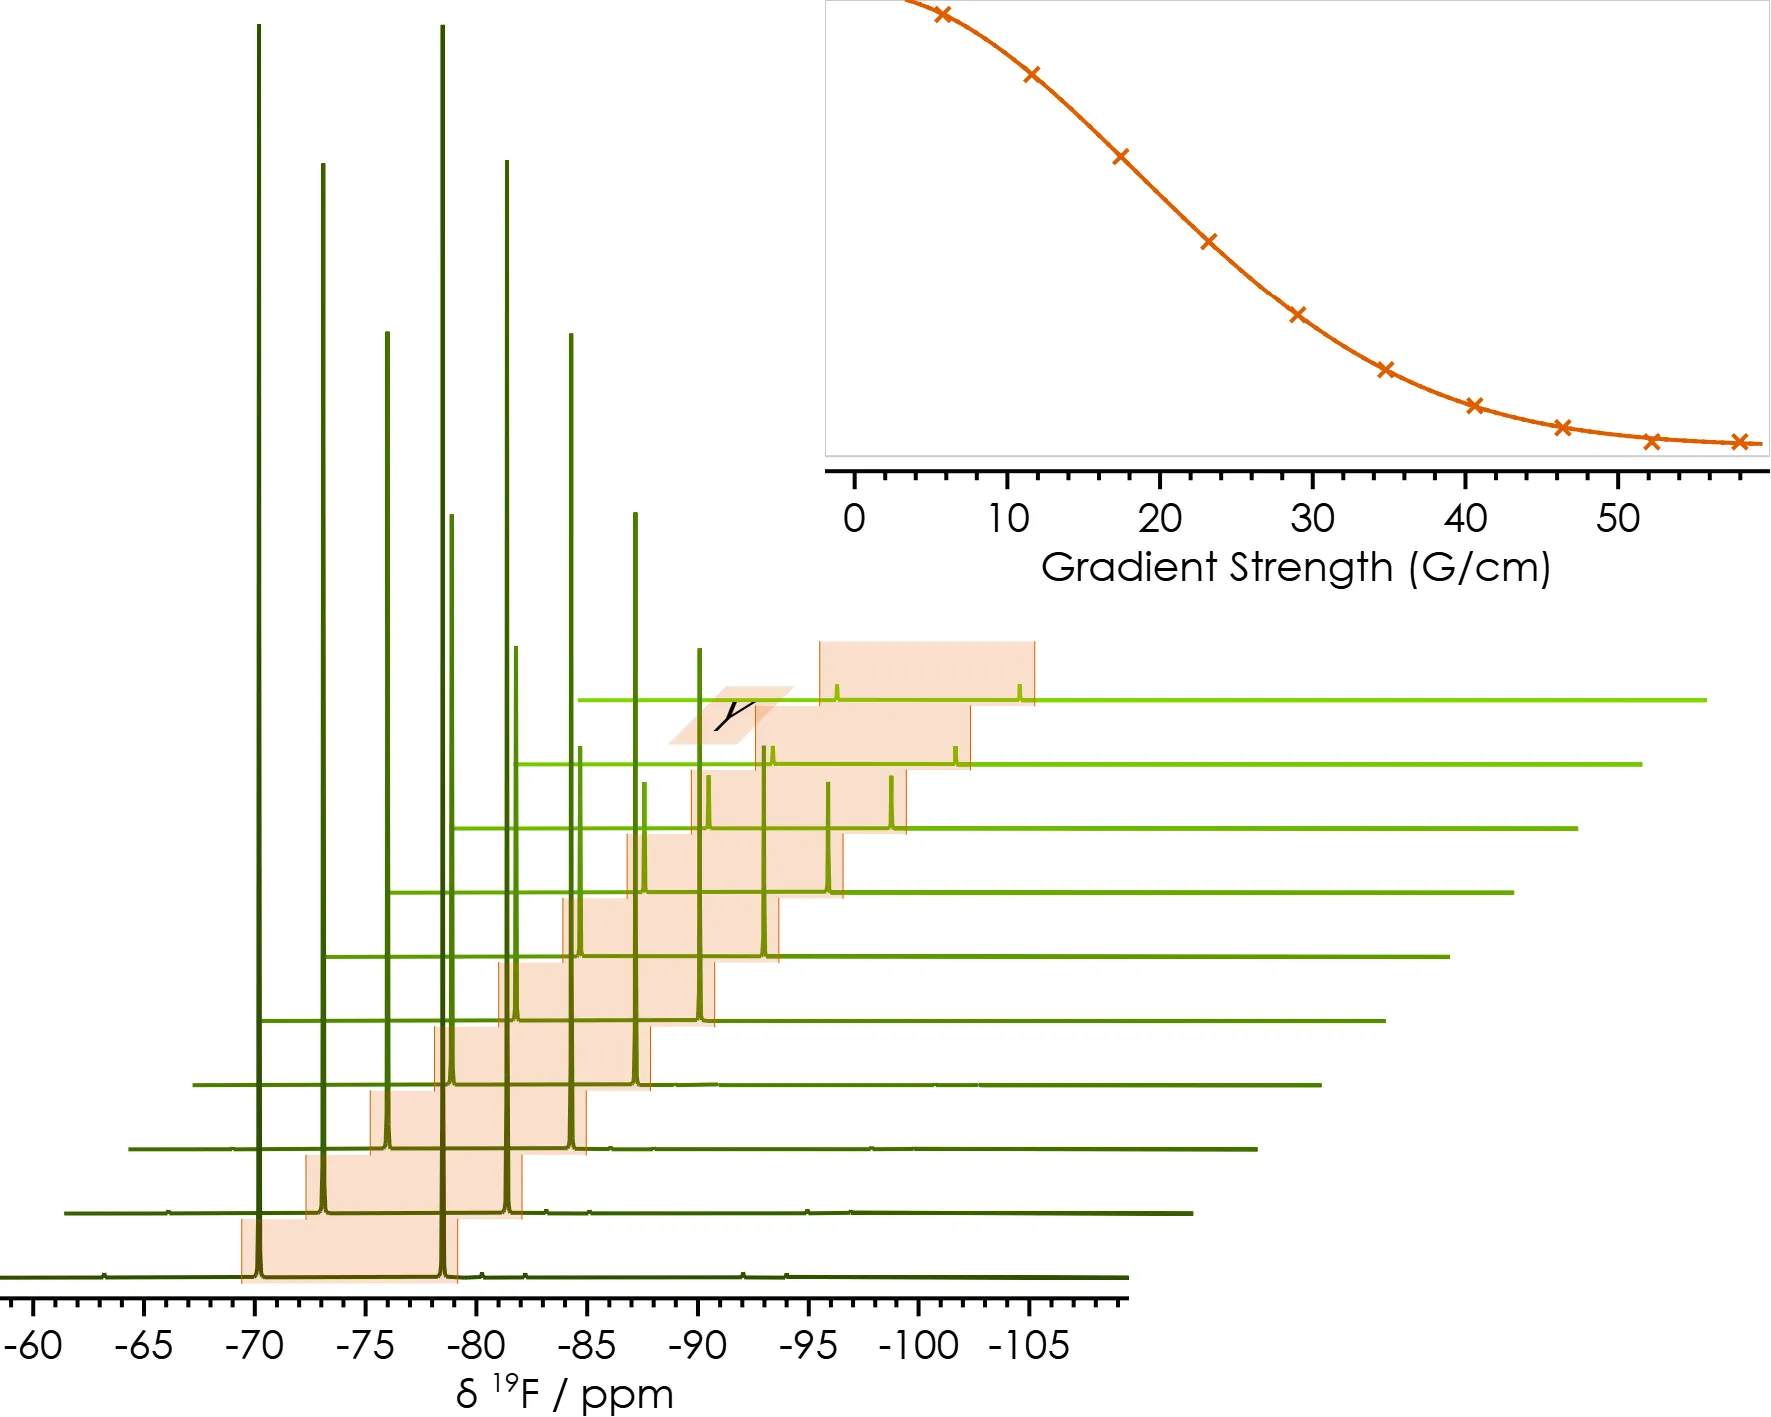
Figure 3.6 19F PGSE spectra of Li-ion battery electrolyte
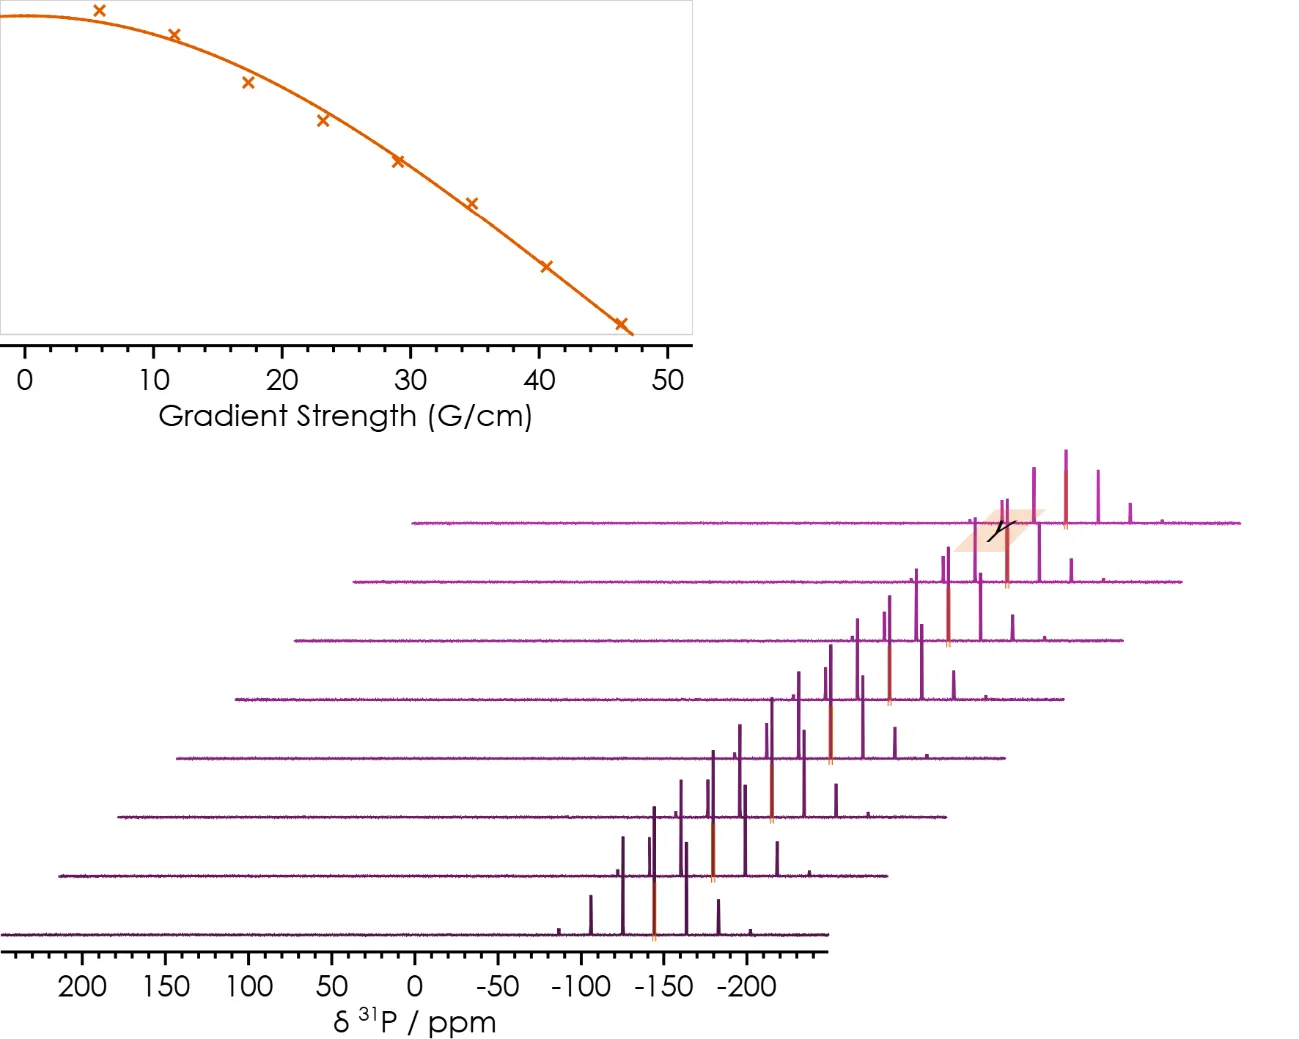
Figure 3.7 31P PGSE spectra of Li-ion battery electrolyte
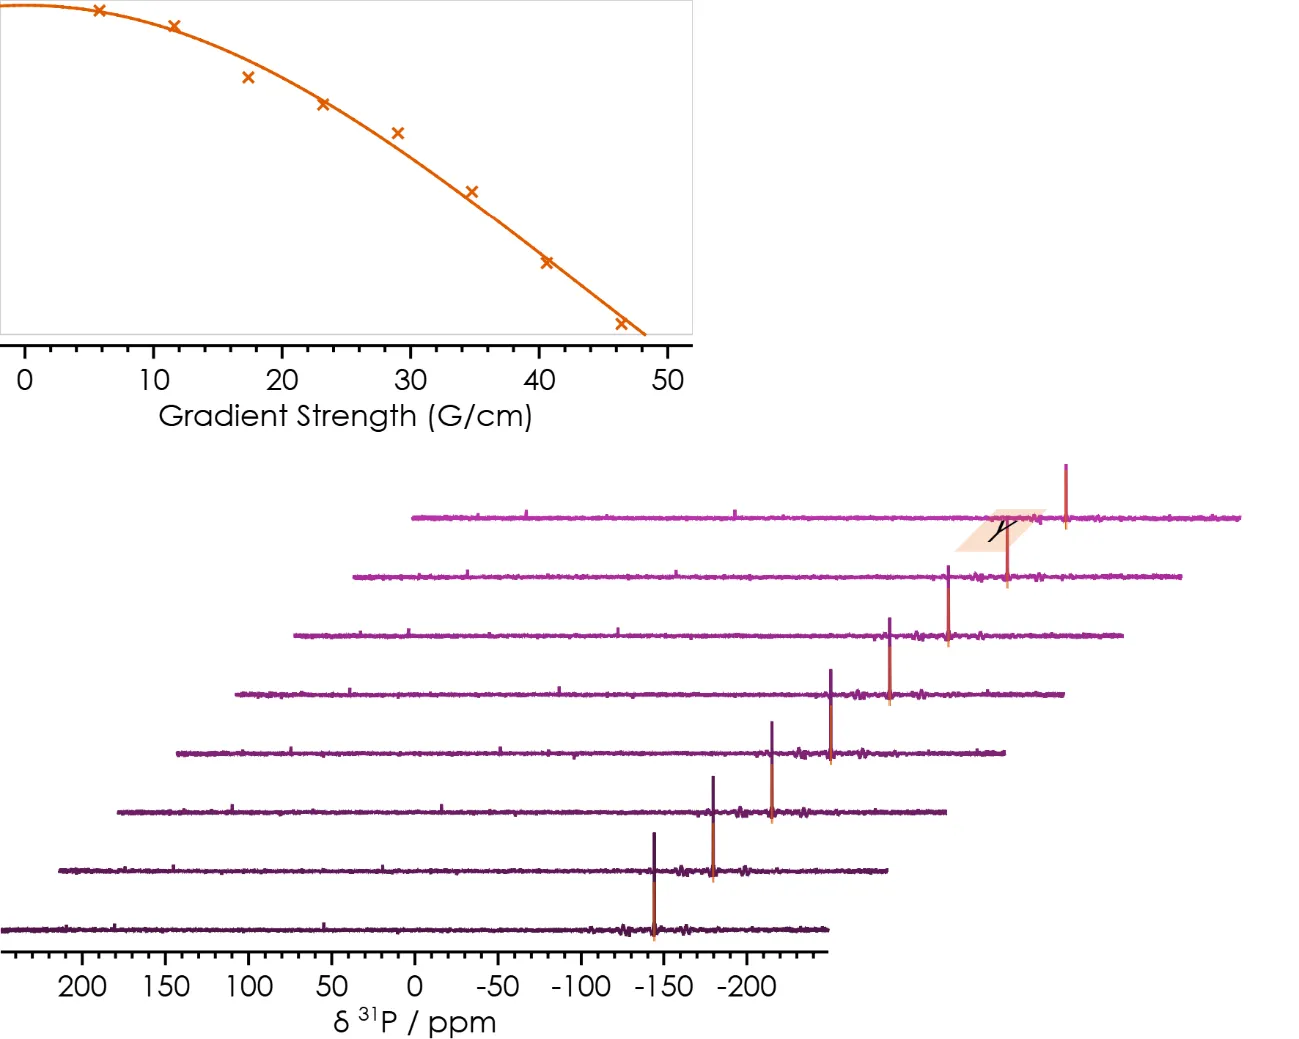
Figure 3.8 31P{19F} PGSE spectra of
Li-ion battery electrolyte
In all three cases, we’d expect to measure the same diffusion constant from each data set, since diffusion is a
molecular property. The measured diffusion constants are shown in Table 3.2. While the measured values for
19F and 31P{19F} are comparable, the value obtained from 31P differs
further.
Table 3.2 Diffusion constants determined for
[PF6]− using different nuclei
|
D / ×10-10 m2/s |
| [PF6]−, 19F PGSE |
4.32 |
| [PF6]−, 31P PGSE |
4.03 |
| [PF6]−, 31P{19F} PGSE |
4.23 |
The significantly higher signal-to-noise ratio (SNR) of the peaks in the 19F spectra compared to those in the
31P spectra, and hence the improved fit of the data to the Stejskal-Tanner equation, show that the value
acquired from the 19F PGSE data set is the most accurate.
Another important point to note is the total duration of these measurements. Since diffusion data should be acquired
with quantitative parameters, measurement time can range from a couple of hours for 19F to significantly
longer for 31P. Therefore, measuring the diffusion constant of [PF6]− with
19F NMR, is not only more accurate but also quicker.
Measuring Lithium Cation Diffusion using 7Li NMR
The most important diffusion constant to determine for a Li-ion battery is that of the charge-carrying lithium cation
itself. This can readily be acquired on the X-Pulse using a 7Li PGSE pulse sequence (Figure 3.9). In this
case the diffusion constant, D, was measured as 8.29×10⁻¹⁰ m²/s.
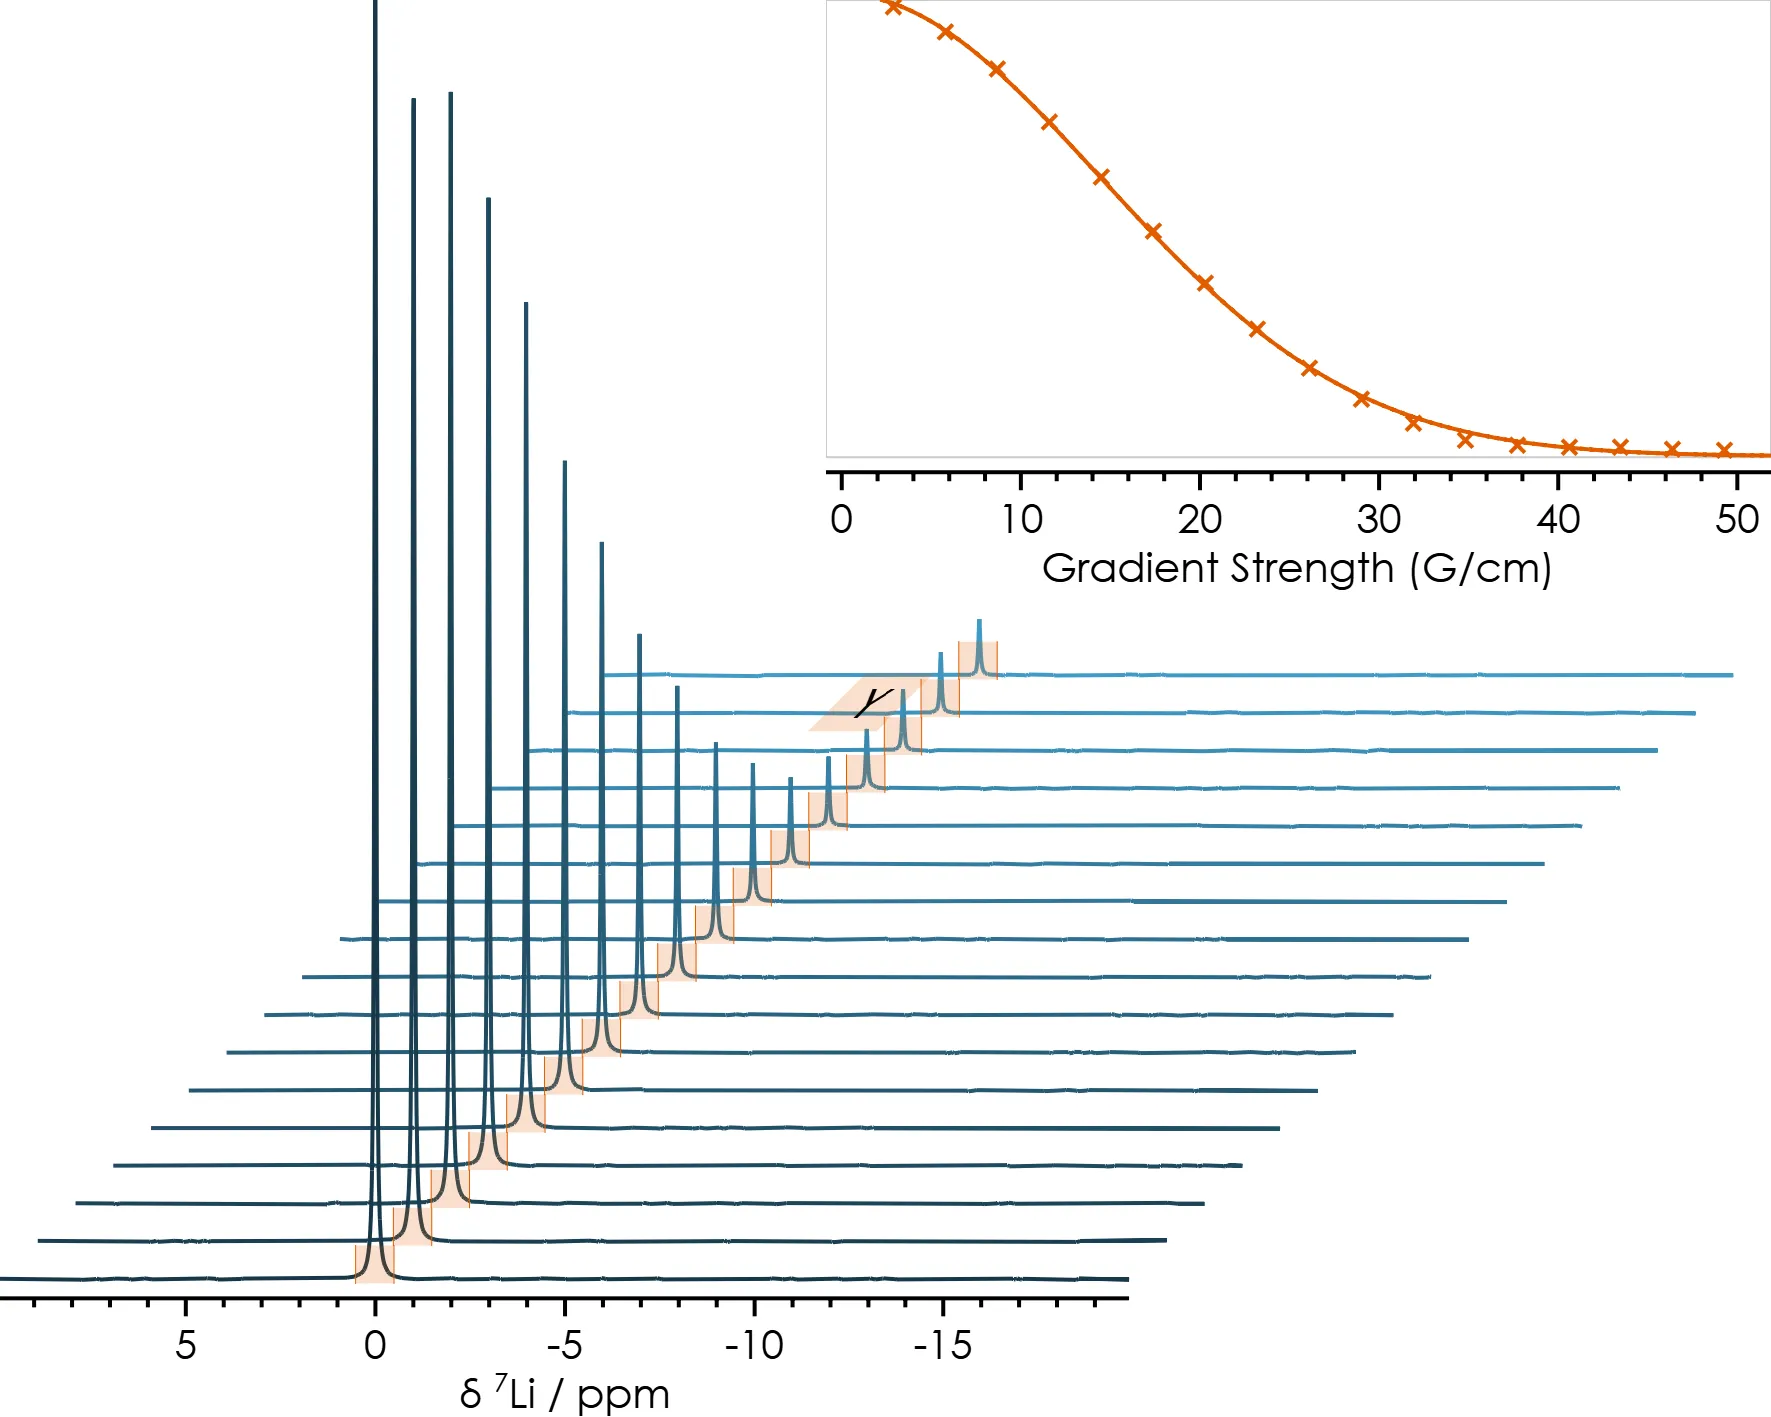
Figure 3.9 7Li PGSE spectra of Li-ion battery electrolyte
Measuring Diffusion at Variable Temperatures
Since diffusion constants vary with temperature, it’s important for Li-ion batteries to determine the diffusion
constants and the related electrochemical properties across the full range of operating temperatures.
The X-Pulse 90 can use a gas variable temperature (VT) system, which can regulate the
sample temperature over a minimum range of 0°C to 60°C. By acquiring 7Li PGSE data sets at different
temperatures (Figure 3.10) and determining the diffusion constants, we can demonstrate how diffusion is
affected by temperature.
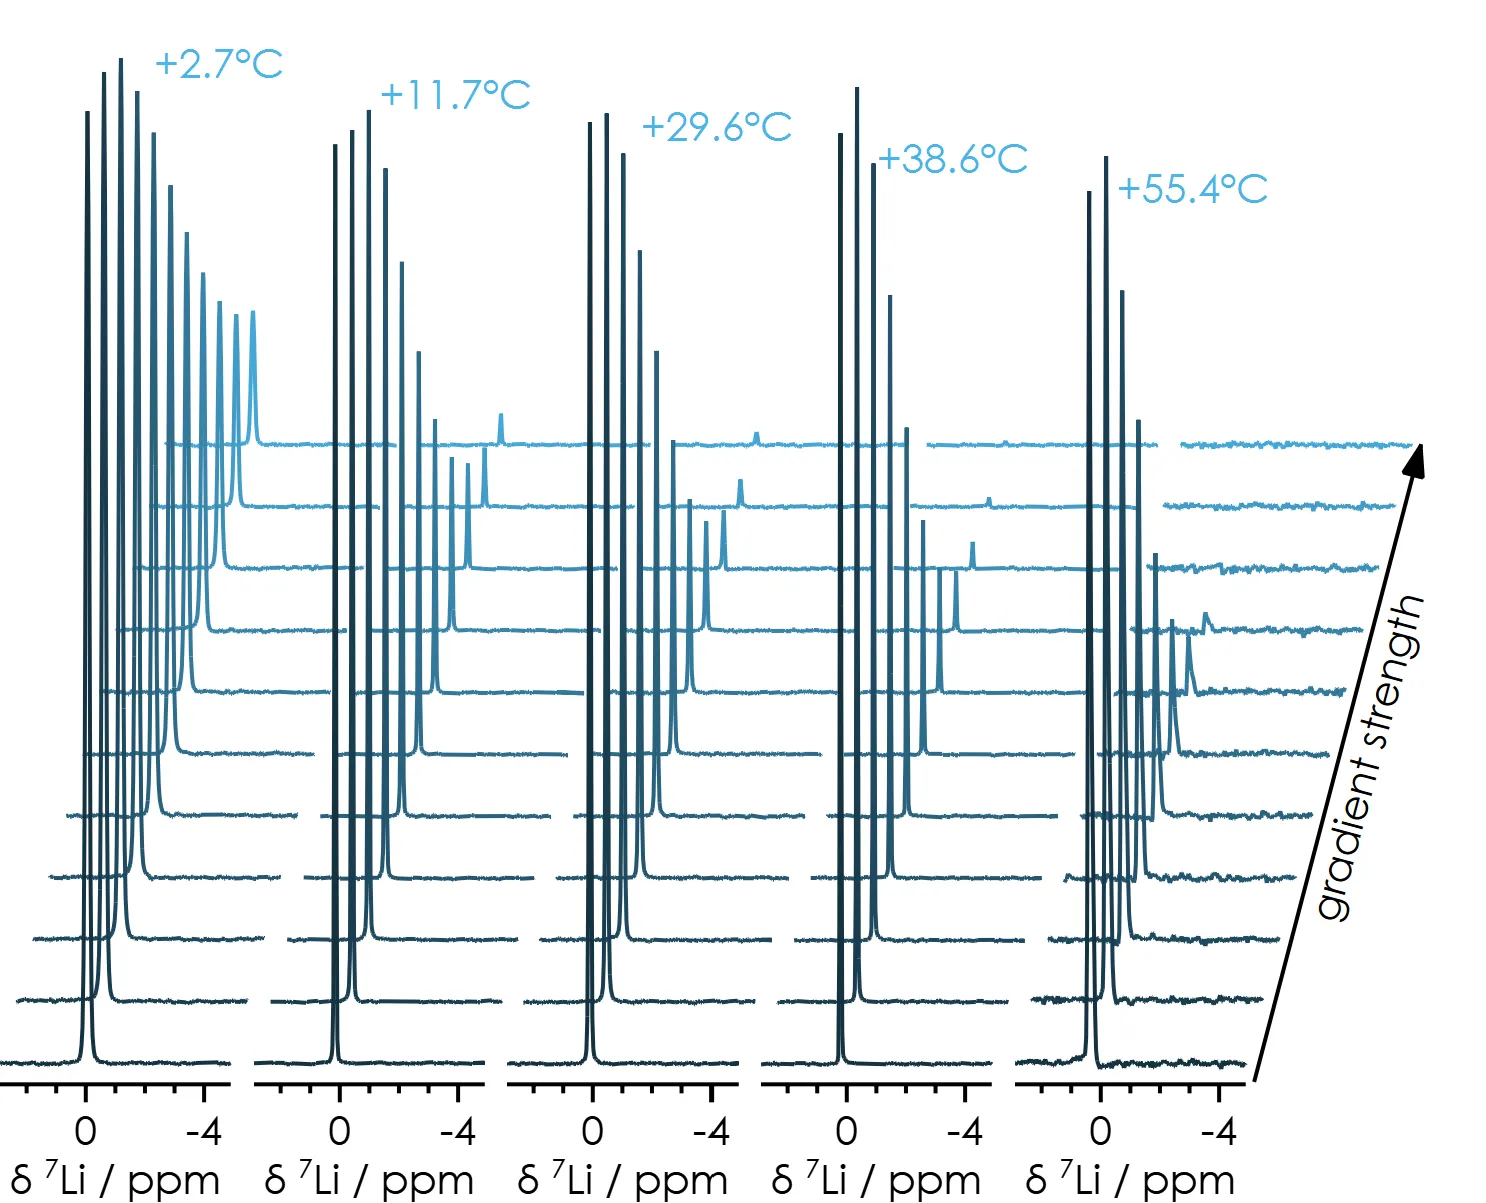
Figure 3.10 7Li PGSE spectra of Li+,
at various temperatures
The diffusion constants of Li+ over a range of different temperatures are shown in Table 3.3. The lower
diffusion constants, and hence slower diffusion, at lower temperatures demonstrate one of the reasons why battery
performance is generally poorer in a cold environment.
Table 3.3 Diffusion constants determined for Li+ at
different temperatures
|
D / ×10-10 m2/s |
| Li+, +2.7°C |
4.64 |
| Li+, +11.7°C |
8.19 |
| Li+, +29.6°C |
9.90 |
| Li+, +38.6°C |
12.65 |
| Li+, +55.4°C |
17.50 |
Summary
The X-Pulse 90 and X-Pulse
60 broadband benchtop NMR spectrometers are ideal tools for measuring diffusion constants in
lithium-ion battery electrolyte. The X-Pulse family of broadband benchtop NMR spectrometers comes with pulsed-field
gradients as standard, allowing for diffusion constants to be determined for a range of different species,
particularly the charge carriers in Li-ion battery electrolytes.
The X-Pulse can operate in a variable-temperature configuration, therefore the relationship between temperature and
the diffusion constants can be determined. Accurately determined diffusion constants are essential for the complete
understanding of battery electrochemistry.
Literature
[1] E. O. Stejskal and J. E. Tanner, J. Chem. Phys., 1965, 42, 288–292, DOI: 10.1063/1.1695690.

