Abstract
Significant development is taking place to Li-ion batteries to get the best performance for each of the many applications that they are used for. Optimising the cathode material is an area of key interest for the current generation of Li-ion battery technologies as even small changes to the cathode can have large overall effects on the battery.
This application note demonstrates how grain size and texture information can be acquired from NCM (nickel, cobalt, manganese) cathode material using Electron Backscatter Diffraction (EBSD). By characterising and comparing samples of different cathode materials at different stages of the battery’s lifetime, it is possible to link the ongoing performance of the material with the microstructure and improve understanding of how the materials change as the battery is repeatedly used.
Introduction
Li-ion batteries have been a key enabling technology over the last decade and are considered integral to future green energy developments. With the continued requirements of reduced CO2 emission and energy usage, batteries are being developed to support consumer electronics as well as Electrical Vehicles (EVs) and energy storage applications. A lot of focus is on electric vehicles which is driving the development of Li-ion batteries and the next generation technology. One of the main objectives is to increase the energy density and thereby eliminate some of the perceived limitations associated with EVs.
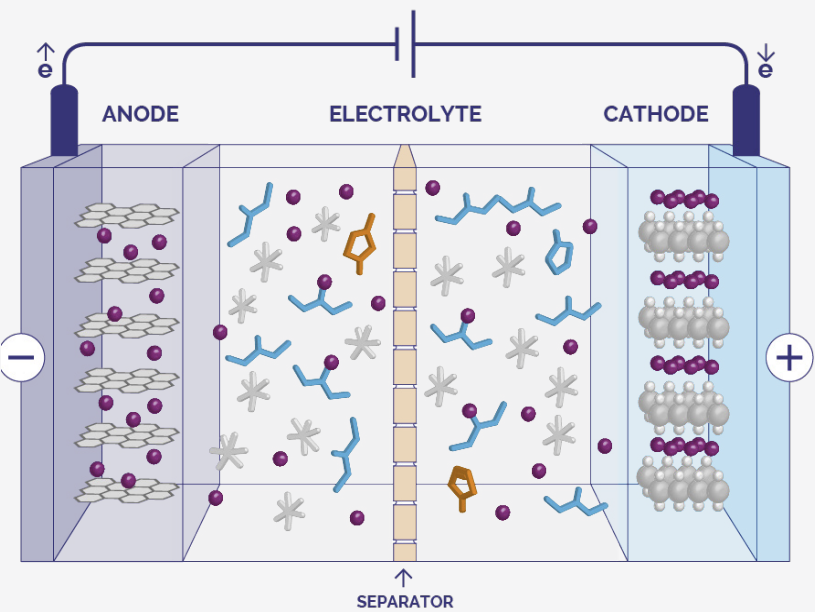
Fig 1. Diagram of a Li-ion battery
Li-ion batteries are typically constructed as shown in Figure 1. The battery consists of an anode, a cathode and an electrolyte. During use the Li-ions move from anode to cathode as the battery is discharged, causing electrons to flow in the connected circuit, providing current for devices.
Significant investments have been made to develop cathode materials to improve the performance of Li-ion batteries. Different cathode materials have been developed for use in different applications depending on the required performance.
Over time, batteries can degrade due to reactions occurring either at the electrodes or in the electrolyte. Understanding how the components might degrade is critical in improving designs and in the subsequent production of higher quality batteries. The cathode material is typically made by mixing different powder materials and as a result the internal structure of the cathodes looks like particles which have been pressed together as shown in Figure 2.
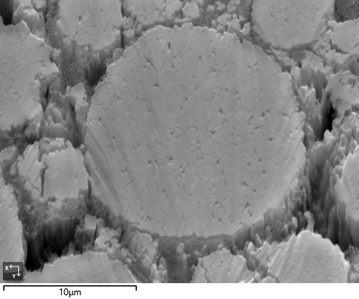
Fig 2. Electron image of NCM particle cross section
SEM based characterisation can help to explain the differences between materials which do and do not perform well, as well as providing a method to study degradation over time. The electrochemical properties of batteries are to a great extent linked to the chemical composition and the morphology of the particles in the cathode material. In most cases the particles are expected to be spherical and have a defined size distribution. Until now, physical and chemical characterisation of the materials has focused on porosity, particle size and chemical composition, while less attention has been paid to the internal structure of the particles. It is known from other fields of materials development that the texture of the material and the distribution of grain boundaries can have a large influence on electrical performance. Hence obtaining this information for battery materials is a key step in improving the performance.
Changes to the microstructure such as changes to grain size, grain boundaries or the introduction of strain caused by expansion and contraction related to the charging and discharging process will also affect battery performance during its lifetime. Understanding the cause of these changes is the first step towards improving the material through engineered microstructures.
Samples and Preparation
For this study, two types of NCM cathode material were analysed. The first sample was a test sample of unknown composition which was analysed using conventional EBSD. Cross sections were prepared using ion milling and samples were transferred to the SEM using a vacuum transfer module to prevent contamination.
The second material analysed was NCM 811 cathode material, with samples taken from both fresh and cycled cathodes. These samples had a smaller grain size than the test sample and, as such, the analysis was performed using TKD (Transmission Kikuchi Diffraction) to improve spatial resolution. TKD measurements are performed using the same hardware and software as EBSD measurements, however the sample must be electron transparent and the diffraction signal is generated by the transmitted electron beam. In order to perform TKD analysis, the sample was prepared as a TEM liftout sample using a focused ion beam (FIB) SEM equipped with an EBSD system.
In the electron image shown in Figure 2, it is possible to see that the NCM particles — e.g. the large particle in the middle of the image — have an internal structure. It is however not possible based on the electron image alone to say if the particle consists of many smaller grains with different orientations or if the contrast variation is due to low angle boundaries or another effect.
EBSD Analysis
EBSD is a SEM based technique which can measure local crystal orientations. This means that the data can be used to extract information about grain boundaries (differences in orientation), grain size and texture (preferred orientations) which might relate to the electrical performance and stability of the material. It therefore provides a method to quantify the variations which can be seen in the electron image.
EBSD data was collected using AZtec software and a Symmetry CMOS EBSD detector at high speeds — which allowed the electron dose to the sample to be limited thereby reducing damage. The data was collected at 20kV using a probe current of approximately 10nA.
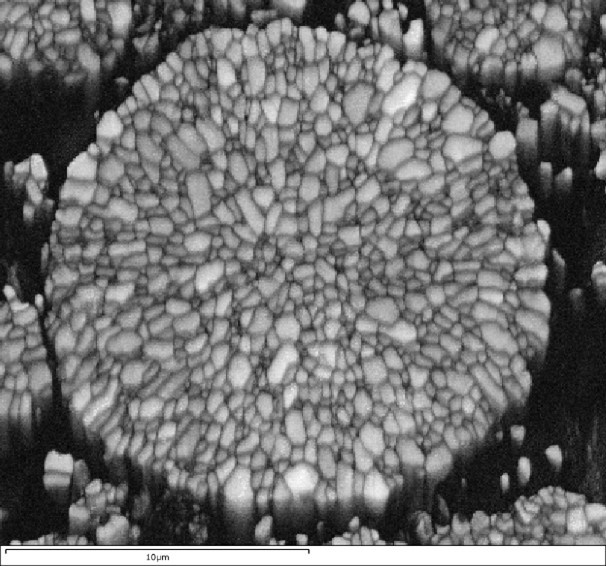
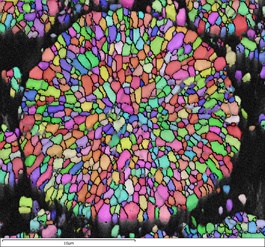
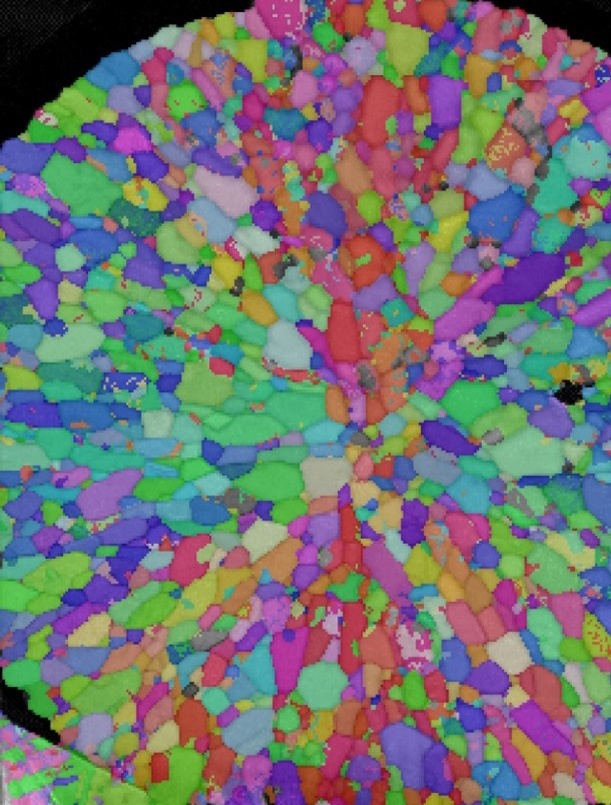
Fig 3. Band contrast map to the left and IPFz map to the right.
EBSD Results (Test sample)
For the first sample, an area centred around the particle shown in Figure 2 was mapped using EBSD. The band contrast map and the inverse pole figure (IPF) map with grain boundaries overlaid are shown in Figure 3.
The band contrast map is a grey scale map generated based on the quality of the diffraction pattern. It displays the internal grain structure of the particle and shows that the internal grains are crystalline as there are well defined light grey domains. The black areas are where no diffraction patterns were detected and typically represent voids and amorphous areas. The dark grey areas are where the quality of the diffraction patterns was poor — these are typically grain boundaries and areas with significant surface damage.
The IPF colour scheme colours the pixels based on crystal orientation along the surface normal, with differences in colour corresponding to differences in orientation. If the map is dominated by a single colour, then it means that crystals are aligned with a specific orientation and the material has a strong texture. The data can easily be mined to extract grain size statistics and it can be shown that the average grain diameter is 0.6µm which is much smaller than the diameter of the NCM particle in Figure 2, which has a 15µm diameter.
These results show that it is possible to use EBSD to obtain grain size and texture information from this type of material if cross section samples are prepared.
TKD Results (NCM 811)
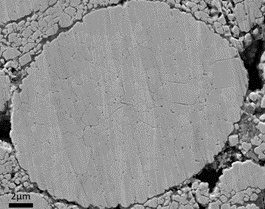
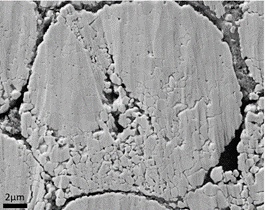
The samples of NCM 811 material were studied in a FIB-SEM before and after cycling. The images in Figure 4 clearly show that after cycling, cracks have been formed and the material is degrading. Based on the FIB images, the smaller grains in this material were estimated to have grain sizes below 100nm.
(a)
(b)
Fig 4. NCM 811 cathode material, a) fresh electrode b) electrode after multiple charge and discharge cycles.
The NCM 811 material was first characterised using x-ray diffraction to determine the unit cell parameters. This information was used for the TKD analysis to ensure correct orientation measurements with the aim of trying to determine if the crack formation was related to crystallography.
A pre-production powder particle was first mounted on a lift-out grid and thinned to electron transparency in the FIB, then re-positioned for TKD analysis. Initially analysing a pre-production powder particle provided a simple test of the method before material from produced cathodes was analysed.
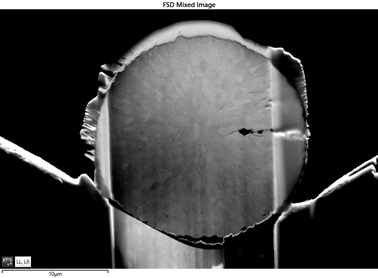
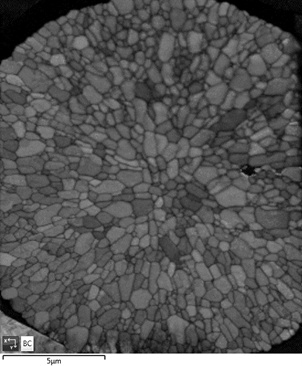
Figure 5 shows the thinned particle attached to a grid together with band contrast and IPF maps from the TKD data acquisition. The electron image generated using a forescattered electron detector (FSD) shows that the internal structure is still visible after the thinning process. The band contrast map shows the grain boundaries and the pores in the powder particle. The IPF shows the orientation of the grains within the particle — the map is not dominated by a single colour, indicating that the powder particle does not have a strong texture.
(a)
(b)
(c)
Fig 5. NCM 811 powder particle. a) FSD image based on orientation contrast of thinned sample. b) Band contrast map generated based on TKD measurement. c) IPF map showing grain orientation in the powder.
The average grain size diameter can be calculated to be 400nm with grains below 100nm diameter well resolved in the dataset.
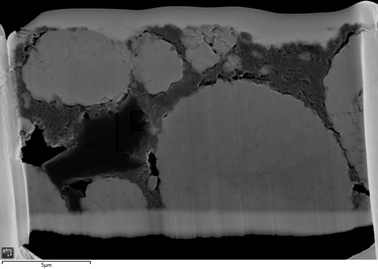
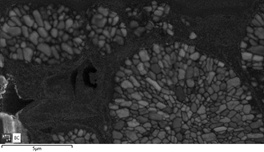
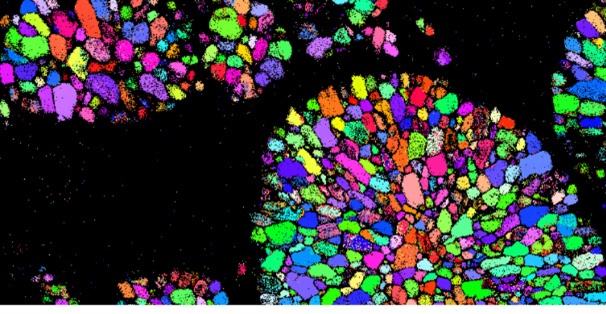
An additional example of EBSD analysis of cathode materials can be seen in Figure 6 which shows an electron image and TKD data obtained from a thin lamella extracted from a used cathode. The electron image shows how the particles are embedded in the material and indicates how useful orientation data can be obtained from real life materials.
(a)
(b)
(c)
Fig 6. NCM 811 cathode material. a) Electron image of liftout sample. b) Band contrast map generated based on TKD measurement. c) IPF map showing grain orientation in the powder.
Conclusion
A lot of development is being done in the area of battery materials to support future energy requirements. Cathode materials are generally crystalline and therefore can be analysed in the SEM using EBSD or TKD depending on the spatial resolution required. EBSD and TKD can provide information about texture, grain size and boundary distributions, all of which are expected to relate to the electrochemical performance of the cathode material and therefore the battery. The increased performance of CMOS EBSD detectors means that it is now possible to characterise this type of material within a few minutes, providing rapid turnaround times and more information to aid in the development of the next generation of devices.
Acknowledgement
We would like to thank WMG, University of Warwick who in collaboration with Jaguar Land Rover acquired and provided the TKD data.

