1. Introduction
Cereal products such as bread and cake are made up of different ingredients, including starch, proteins, fats, sugars and water, that interact during baking, cooling and storage. These interactions affect the structure and texture of the final product. During storage, starch can reorganise and moisture can move within the product, making the structure firmer and contributing to crumb firming. Monitoring these changes is important for evaluating self-life, formulations and processing conditions.1

Time-domain nuclear magnetic resonance (TD-NMR) probes the mobility of hydrogen-containing species without resolving a conventional chemical spectrum. In cereal systems, transverse relaxation time (T₂) is particularly useful because proton populations in different physical and molecular environments have distinct relaxation times. The Carr-Purcell-Meiboom-Gill (CPMG) experiment is the most common technique used to measure the transverse relaxation time of liquid-like components. It generates a train of echoes whose amplitude decreases over time, producing a relaxation decay that can be analysed as a distribution rather than as a small number of fixed exponential components. This approach is well suited to complex and heterogeneous food systems, such as cereal products.1
2. Monitoring Structural Changes in Cakes Using T₂ Distribution
Cake samples (fresh and after three weeks of storage) were measured at 20 °C using an MQC-R (23.4 MHz for ¹H), equipped with a ¹H liquid variable-temperature 18 mm probe and operated using NMR ProLab software. A CPMG experiment was performed using 8192 echoes and τ = 100 µs. T2 decays were processed using one-dimensional inverse Laplace transformation (1D ILT) to obtain a T₂ distribution. NMR ProLab for MQC-R software provides a user-friendly workflow for T₂ acquisition and integrated ILT processing. Instructions on how to set up a T₂ relaxation measurement in NMR ProLab can be found in this tutorial.
In the T₂ distribution, the peak position reflects characteristic relaxation behaviour, while the peak area and width provide complementary information about the relative signal contribution.1
The T₂ distributions of both fresh (dark blue) and stored (light blue) cake show multiple components, reflecting the heterogeneous nature of the sample and the presence of proton populations with different mobilities, mainly from water and lipids. In general, shorter T₂ values indicate more restricted molecular motion, while longer T₂ values are associated with greater mobility. Individual peaks may contain overlapping contributions from both water and lipid protons, so peak assignments should be interpreted with care.1,2
In this study, the CPMG experiment captured only the more mobile, liquid-like components. However, relaxation measurements can be extended by combining the Free Induction Decay (FID) and CPMG pulse sequences. FID signal provides information on proton populations with more restricted mobility that are not detected by CPMG, such as non-exchanging CH protons in crystalline starch, proteins, crystalline fat, and amorphous starch and gluten.2 NMR ProLab offers a wide range of relaxation and diffusion methods, including the combined FID-CPMG method (data acquisition and processing).
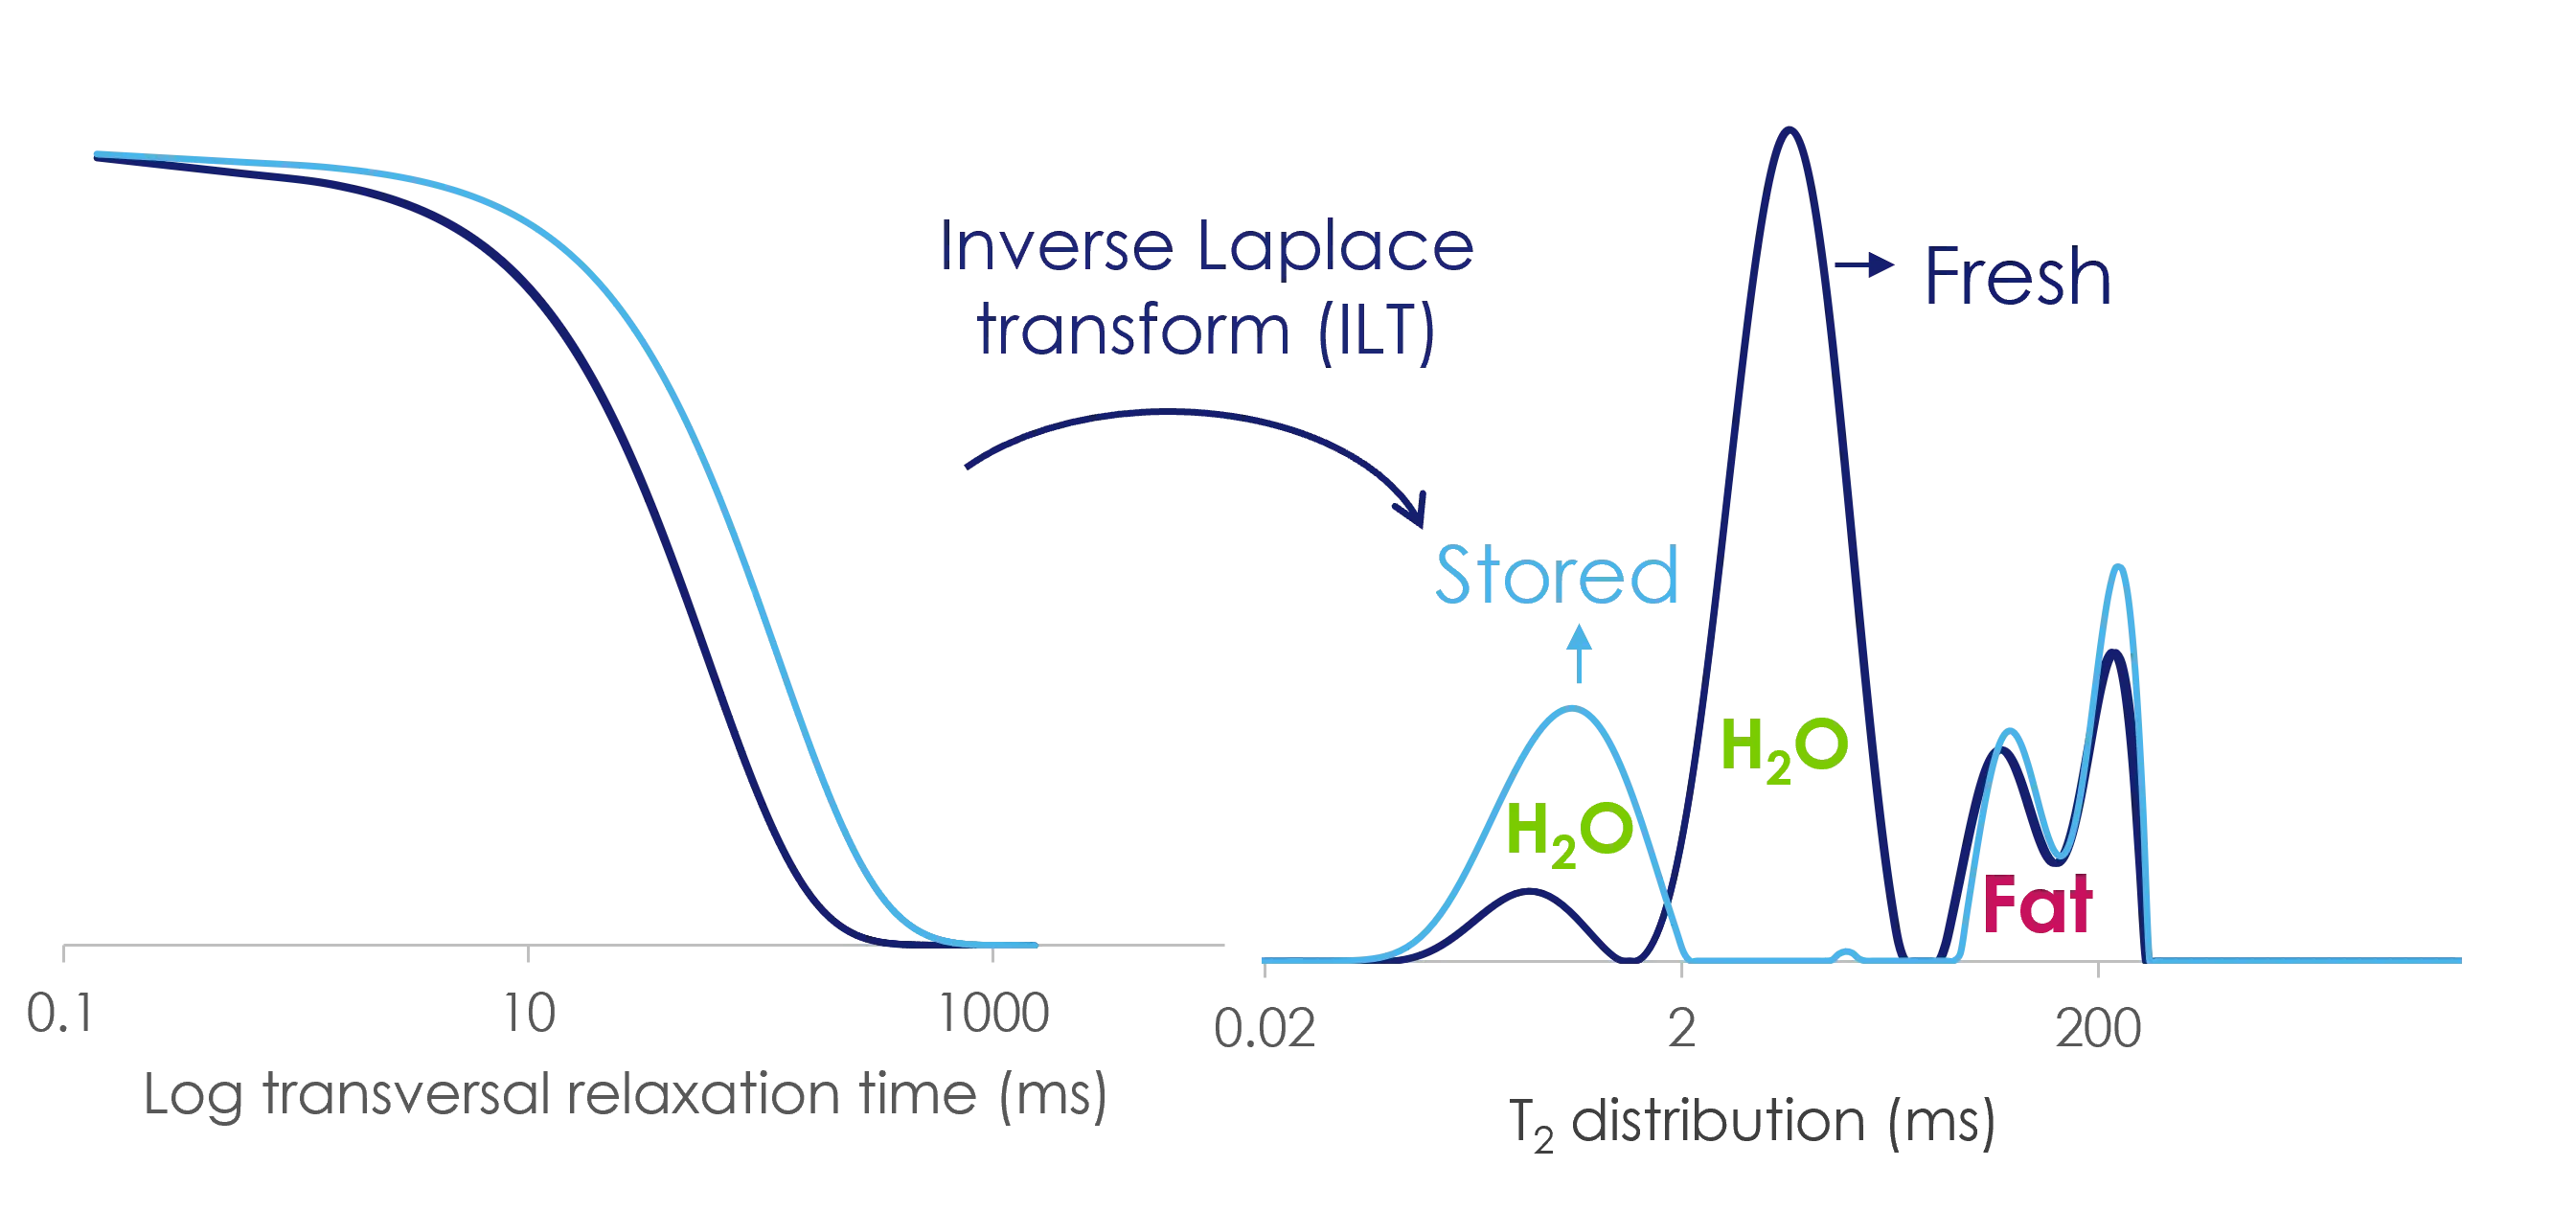
Figure 1. Fresh (dark blue) and stored (light blue) cake: CPMG T₂ decay and corresponding 1D ILT - T₂ distribution.
The proposed peak assignments are presented in the table and are based on the literature.1,2 The relaxation decay curves and T₂ distributions differ between the fresh and stored cake samples. The T₂ distribution of the stored cake suggests a redistribution of water and a reduction in water mobility, indicating a more rigid matrix after storage. This behaviour is consistent with published studies showing an overall decrease in proton mobility during the storage of cereal products.1,2,3
Proposed peak assignments
| Relative region | Possible interpretation |
| Shorter T2 | CH protons of amorphous starch and gluten and protons from confined water; crystalline lipid may also contribute. |
| Intermediate T2 | Exchangeable protons from water, starch and protein within cake network. |
| Longest T2 | Mostly lipid protons; mobile water may also contribute. |
Alternative methods to study cake’s structure changes include scanning calorimetry (DSC), texture analysis, water activity and moisture measurements, X-ray diffraction (XRD), magnetic resonance imaging (MRI) and microscopy. While these techniques provide complementary information, TD-NMR offers the advantage of minimal sample preparation, preserving the native sample structure while enabling non-destructive, highly repeatable measurements that are sensitive to molecular mobility and water redistribution.
3. Summary
T₂ distributions provide a comprehensive view of structural changes in cake during storage. The differences observed between the fresh and stored samples are associated with moisture redistribution, reduced water mobility and increased matrix rigidity.
MQC-R with NMR ProLab software provides an accessible workflow from CPMG acquisition to integrated 1D ILT processing, supporting product development, formulation comparison, stability studies and quality control method development for cakes and other cereal products.
In addition, NMR ProLab for MQC-R includes a comprehensive library of methods for exploring the structure and molecular mobility of cereal products. These include FID-CPMG experiments for characterising both rigid and mobile components, as well as advanced 2D pulse sequences that combine relaxation-relaxation and relaxation-diffusion measurements, enabling a more detailed investigation of food structure and its evolution during processing and storage.
References
1. Bosmans, G. M.; Delcour, J. A. “TD NMR Relaxation Studies of Cereal Products.” In Modern Magnetic Resonance; Springer, 2018; pp 1431–1448. https://doi.org/10.1007/978-3-319-28388-3_13.
2. Luyts, A.; et al. “Low Resolution ¹H NMR Assignment of Proton Populations in Pound Cake and Its Polymeric Ingredients.” Food Chemistry 2013, 139, 120–128.
3. van Duynhoven, J.; et al. “Time-Domain NMR Applied to Food Products.” Annual Reports on NMR Spectroscopy 2010, 69, 145–197.

