Life Science research is increasingly using three-dimensional modelling systems such as organoids and spheroids to study cellular interactions, tissue organisation and disease mechanisms in physiologically relevant environments. Confocal Raman imaging adds high value to organoid studies, providing label-free biochemical information at high spatial resolution. These features are particularly useful for structurally complex organoids, as they enable detailed characterisation of whole, intact samples on the cellular and subcellular level, without the need for extensive labelling protocols.
This article highlights two published studies from the research group of Prof. Molly M. Stevens that demonstrate how Oxford Instruments Raman technology can be used for in-depth biochemical characterisation of organoids.
Learn about the fundamentals of confocal Raman imaging for Life Science applications here.
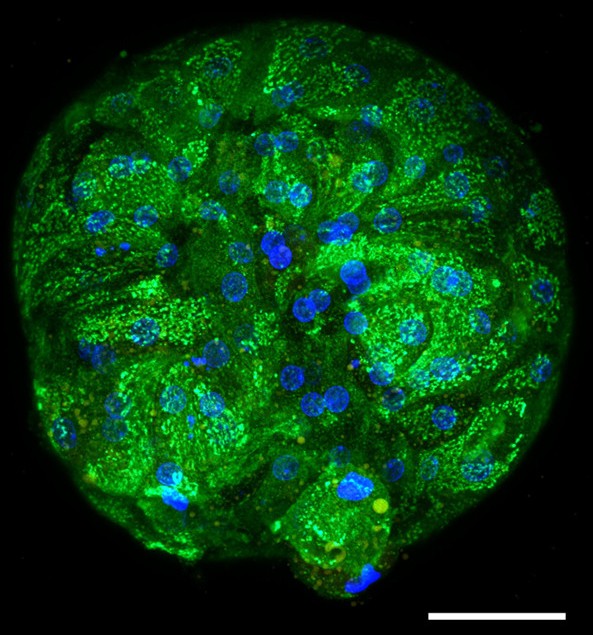
Image credit: LaLone et al., Cell reports methods, 2023 [1]. Published under a CC-BY 4.0 open-access licence.
The importance of confocal imaging for organoid analysis
To obtain sharp images throughout an organoid, optical sectioning that minimises out-of-focus signal contribution is essential. The high confocality of Oxford Instruments’ Raman microscopes allows for precise depth-resolved imaging in three-dimensional samples. Depending on the optical configuration, spatial resolutions below 300 nm laterally and 950 nm axially can be achieved. This enables detailed 3D visualisation of the spatial distribution of biomolecular components within complex biological samples.
Quantitative Raman analysis of hepatocyte organoids for chemometric phenotyping
In this first study by Vernon LaLone et al [1], confocal Raman imaging was used to reveal chemical and structural differences between hepatocyte organoids derived from pluripotent stem cells or primary human cells. The researchers developed a qRamanomics bioanalytical platform for quantitative chemometric phenotyping and applied it to investigate drug-induced alterations in three-dimensional biological samples.
Experimental setup
Organoids were illuminated using a 532 nm laser, and Raman spectra were acquired in the range of 0 – 3600 rel. cm-1. Samples were scanned over a z-range of 50 µm using a lateral step size of 2 µm and axial step size of 10 µm.
Results
The analysis identified and simultaneously quantified a range of biomolecules within the organoids, including lipids, proteins, nucleic acids, cytochrome c and glycogen, as shown for a primary hepatocyte spheroid in Figure 1. The approach enabled high-content compositional comparisons between cultures of different origins at cellular and subcellular resolution.
Access the full study by Vernon LaLone and coworkers, published in Cell Rep Methods, here.
Published under a CC-BY 4.0 open-access licence.
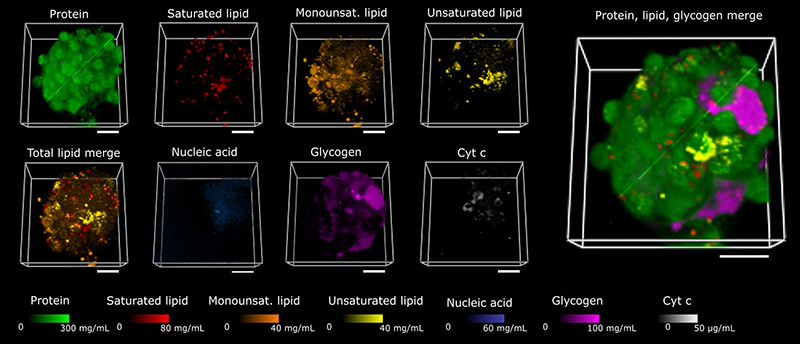
Figure 1: High-content qRamanomics imaging of a whole primary hepatocyte spheroid. Scale bar: 50 µm. Image adapted from [1].
Volumetric imaging of the neural rosette from a neural organoid
In the second study by Dimitar Georgiev et al [2], the researchers combined confocal Raman imaging with deep-learning-based data analysis to visualise cellular and subcellular features of a neural rosette within an intact neural organoid. Neural rosettes are important structures for studying neural tube formation during early development of the central nervous system.
Experimental setup
Measurements were performed using a 532 nm laser excitation on intact neural organoids. Raman spectra were recorded in the range of 0 – 3670 rel. cm-1, with a pixel size of 2 µm in both the XY and Z dimensions.
Results
Deep-learning enhanced analysis of the Raman hyperspectral images identified several components that can be associated with nucleic acids, lipids and proteins, which showed distinct spatial distributions across the neural rosette (Figure 2). The approach further enabled the investigation of biochemical changes at different stages of organoid maturation, providing insight into the molecular processes during early neurodevelopment.
Access the full study by Dimitar Georgiev and collaborators, published in Science Advances, here.
Published under a CC-BY 4.0 open-access licence.
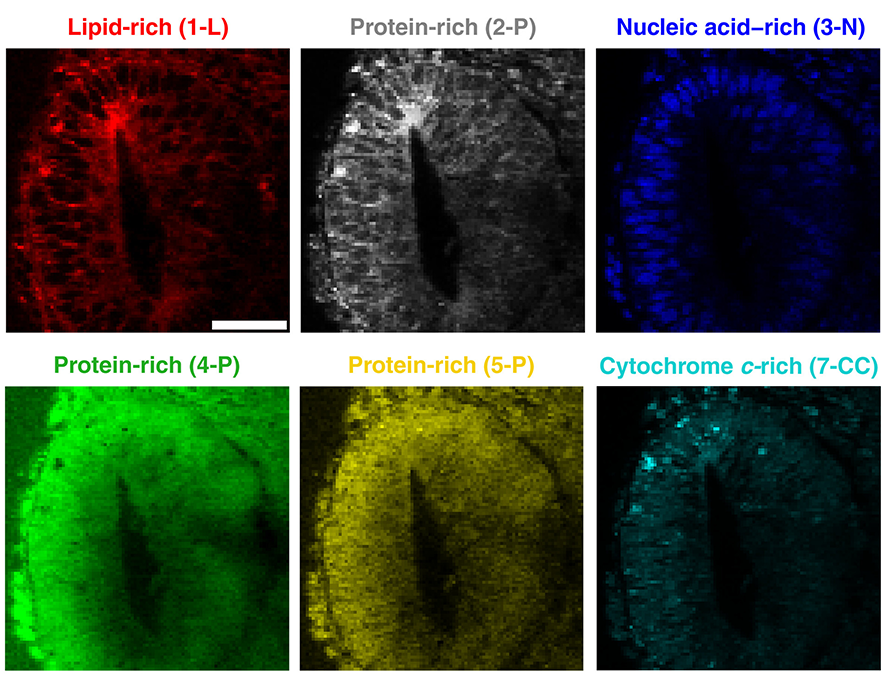
Figure 2: Volumetric in-situ biochemical imaging of a neural rosette within an intact neural organoid. Scale bar: 50 µm. Image modified from [2].
Literature
[1] LaLone, V., Aizenshtadt, A., Goertz, J., Skottvoll, F. S., Mota, M. B., You, J., ... & Stevens, M. M. (2023). Quantitative chemometric phenotyping of three-dimensional liver organoids by Raman spectral imaging. Cell reports methods, 3(4). https://doi.org/10.1016/j.crmeth.2023.100440 [2] Georgiev, D., Xie, R., Reumann, D., Zhao, X., Fernández-Galiana, Á., Barahona, M., & Stevens, M. M. (2026). Label-free biochemical imaging and time point analysis of neural organoids via deep learning–enhanced Raman microspectroscopy. Science Advances, 12(33), eaec5080. https://doi.org/10.1126/sciadv.aec5080

