Introduction
Meteorites are considered some of the most primitive surviving materials from the formation of our solar system. As such, these objects can provide information about planetary formation through their properties – including their structure, composition and morphology. Meteorites often have airmarks and molten crusts formed by the impact of airflow on their surface during entry through the atmosphere, and, in addition, before being discovered by humans they often go through erosion by wind, frost, rain and dew. This can make it very difficult, even for experts, to identify a meteorite based on its appearance. Therefore, it is important to apply an appropriate method to measure a candidate meteorite's composition and to ensure correct identification and deduce origin and formation.
In this application note we demonstrate how a suspected meteorite has been characterised by scanning electron microscopy coupled with Energy Dispersive X-ray Spectrometry (SEM/EDS), to determine its authenticity and classification.
A combination of approaches was used in the investigation of the sample and will be discussed here. BSE imaging of the centimeter-scale sample cross section was used to identify the distribution of chondrules. Standardless quantitative analysis was used to assess the chemical compositions of the minerals and accurately identify the specific mineral phases present, according to their stoichiometry. Finally, the EDS Mapping and the AutoPhaseMap functions in AZtec were used to obtain the exact proportion of each mineral phase in the meteorite.
Sample
The sample is a suspected meteorite found in North Africa, weighing ~10g. It is oval in shape with pits on the surface which is severely weathered, and no fusion crust that can be discerned by the naked eye. It is also clearly magnetic – being attracted to a hand held magnet. This magnetism can lead to a false interpretation: that because it is magnetic it must be a real meteorite - further research is needed with the help of microanalytical methods for confirmation.
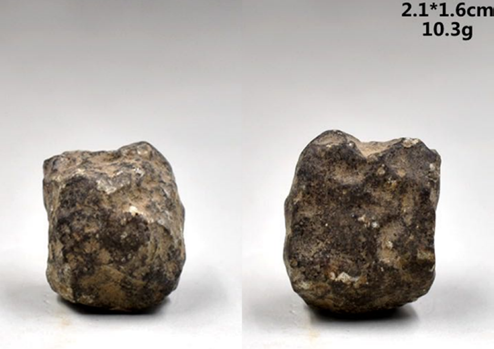
Fig 1. Hand specimen of the suspected meteorite
The suspected meteorite was cut in half, mounted in resin, mechanically polished, and coated with carbon. Figure 2 shows a cross section of the sample after polishing. The clear colour variation implies that the composition varies across the sample. Particles with a metallic lustre are also visible. From viewing the complete section, it is evident that the weathering is limited to the exterior and no obvious corrosion marks are seen inside.
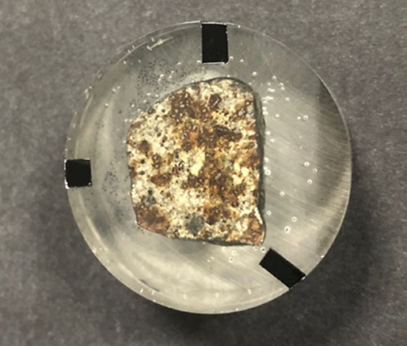
Fig 2. Cross-section of the suspected meteorite
SEM-based Mineral Analysis
The SEM is a powerful imaging tool. Backscattered electron (BSE) images are often used for the detection, imaging and characterisation of minerals. Contrast in BSE images is generated by differences in the mean atomic number of the materials that the SEM's electron beam passes over with more dense materials typically appearing brighter and less dense materials appearing darker. This makes BSE imaging ideal for locating different mineral phases. The entire cross section of this sample was imaged on a field emission SEM using BSE imaging. By combining the SEM with an EDS system, chemical information could additionally be obtained. A large area Ultim® Max 170 mm² silicon drift detector (SDD) was used with the AZtecLive EDS software for this study. All acquired data was automatically processed with AZtec's Tru-Q™ algorithms to ensure that element identification and quantification of the highest quality was achieved.
Results
Large Area Mapping (LAM)
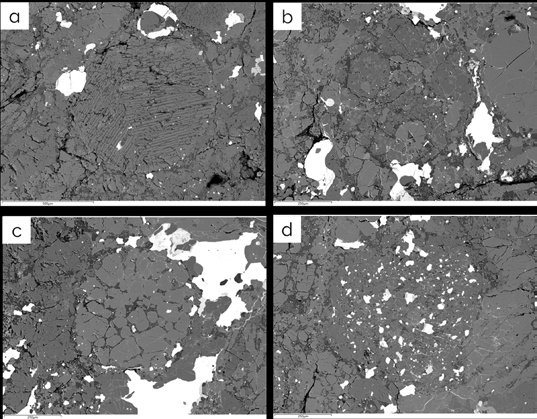
Fig 3. BSE images of typical chondrules in the cross section
Several typical chondrules were observed in the BSE images, with a diameter of hundreds of microns and clear boundaries with the matrix. The areas with higher brightness in the BSE image are presumed to be metal. There is a significant variation between the chondrules with differences in their internal structures being seen. The chondrules in Figure 3(a) appears to be barred olivine, with a small amount of uncrystallized interstitial glass. The structure of the chondrules in Figure 3(b-d) are patchy, with different numbers of metal particles being present. Chondrules are a typical feature of ordinary chondrite meteorites. Based on this, the authenticity of the suspected meteorite can be preliminarily determined, but further evidence needs to be found for characteristic minerals.
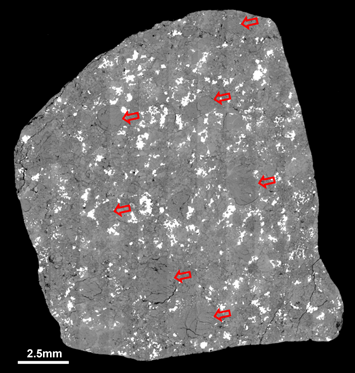
Fig 4. Montaged BSE image of the entire cross section
The Large Area Mapping (LAM) function in the AZtec software was used to obtain a montaged BSE image of the entire section. The locations of the chondrules of the meteorite can clearly be seen (indicated by the arrows). The shape of the chondrules in the core of the section remain intact with clear boundaries and thermal metamorphism is not obvious. The chondrules at the edge of the section are deformed and cracked, indicating that the meteorite was subjected to severe impact.
The bright areas account for a relatively low proportion of the BSE image, which indicates that the iron-nickel content is low. According to the classification standard, this meteorite can be preliminarily divided into the L group of ordinary chondrites in the stony meteorites.
Standardless EDS Quantitative Analysis: Accurate Identification of Specific Minerals
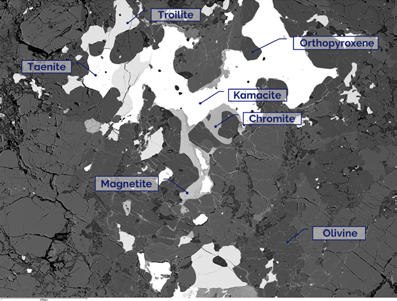
Fig 5. Location of quantitative EDS analysis points on a BSE image
A typical area, showing different compositions based on contrast in the montaged BSE image, was selected for quantitative analysis to identify mineral phases. The locations of the EDS acquisition are shown in Figure 5. Seven distinct phases were identified in this area, including two metallic minerals, one sulfide mineral, two oxide minerals, and two silicate minerals.
Two metallic minerals, kamacite (α-(Fe, Ni)) and taenite (γ-(Ni, Fe)) were found. The quantitative results in Figure 6 show that the Ni content in kamacite and taenite is 6.6 wt% and 54.7 wt% respectively. Kamacite and taenite are two phases in the iron-nickel metal isomorphism series in meteorites and both are superalloy phase minerals. They co-exist in iron meteorites and form a grid-like etched pattern, also known as the Widmanstätten pattern.
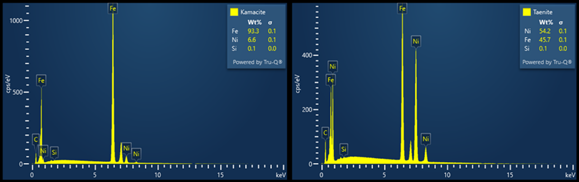
Fig 6. EDS quantitative results from kamacite and taenite
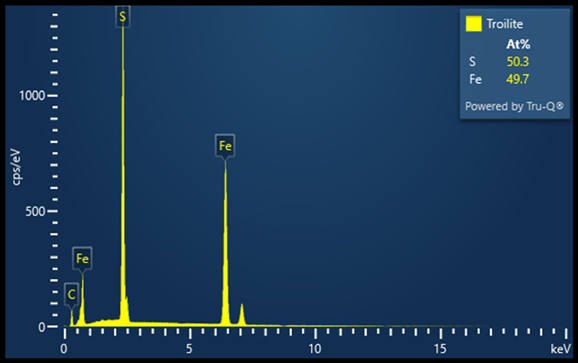
Fig 7. EDS quantitative result from troilite
Figure 7 is a quantified EDS spectrum of a sulfide mineral. The atomic ratio of Fe/ S is very close to 1:1, which can be classified as FeS (Troilite). Troilite can be found as a native mineral on earth, but is more abundant in meteorites, particularly those originating from the Moon and Mars. It coexists with meteorite minerals such as kamacite and taenite. The existence of this mineral further confirms the authenticity of the meteorite.
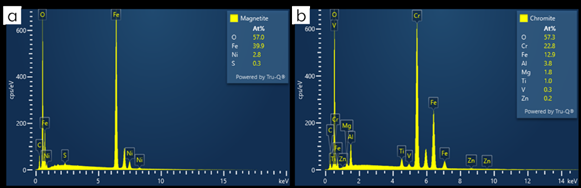
Fig 8. EDS quantitative results from magnetite and chromite
The two oxide minerals are magnetite (Fe₃O₄) and chromite (FeCr₂O₄), both of which belong to the spinel group. The general chemical formula is AB₂O₄. A is +2-valent Mg²⁺, Fe²⁺, Zn²⁺, Mn²⁺, etc., B is +3 valent Fe³⁺, Al³⁺, Cr³⁺, etc. The composition of magnetite was quantified directly for all elements (including O) and the atomic ratio of (Fe+Ni)/O was measured as close to 0.75, as shown in Figure 8(a). The composition of chromite is more complex – Al, Mg, Ti, V, and Zn may displace Fe and Cr. The quantitative result obtained using stoichiometry is shown in Figure 8(b). The atomic ratio of (Fe+Mg+Zn)/(Cr+Al+Ti+V) is about 0.53. The atomic ratio of type A/B elements deviates slightly from the theoretical value of 0.5 because Fe can occupy the B-type atomic position in the +3-valence state.
The two silicate minerals were also quantitatively analysed with oxygen determined by stoichiometry. In olivine ((Fe,Mg)₂SiO₄), the atomic ratio of (Mg+Fe)/Si is close to 2, and the total number of cations is close to 3. The atomic ratio of (Fe+Mg)/Si in orthopyroxene ((Mg, Fe)₂Si₂O₆) is close to 1, and the sum of cations is close to 4. The stoichiometric ratio and theoretical value of the two silicates are very consistent. The orthopyroxene can be regarded as a mixture of orthoferrosilite (Fe₂Si₂O₆) and enstatite (Mg₂Si₂O₆). The molecular content of orthopyroxene is about 20%. Olivine and orthopyroxene are also common minerals in meteorites.
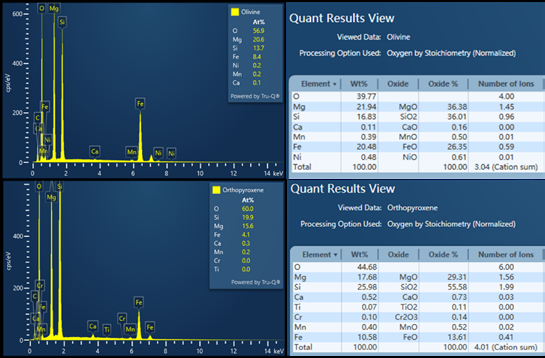
Fig 9. EDS quantitative results from olivine and orthopyroxene
AutoPhaseMap — Accurate Calculation of Mineral Phase Proportions
An EDS Tru-Map was collected for the major elements identified in the chondrules shown in Figure 3(d). These maps provide detailed information about the distribution of elements within the area. The areas with higher concentrations of Fe are kamacite, the areas with lower concentrations of Fe, but higher concentrations of S are troilite. The areas with higher Ni content are taenite and the areas with Cr are chromite. A small number of areas are enriched in K and Ca, corresponding to another type of silicate mineral, feldspar.
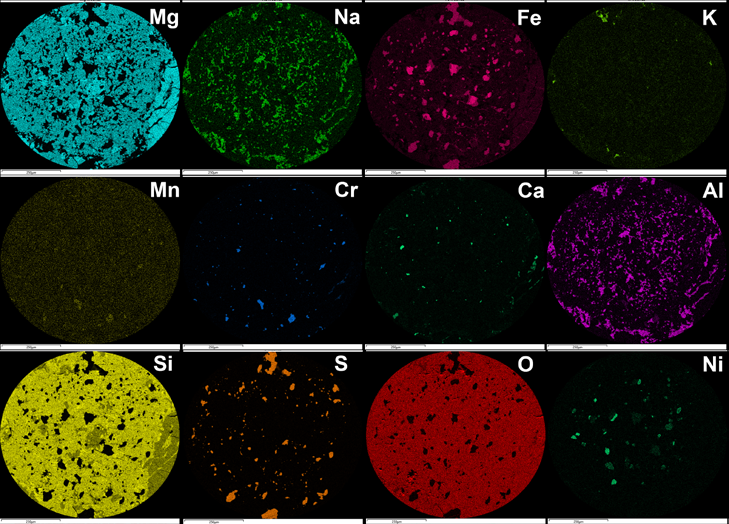
Fig 10. EDS TruMap background and overlap corrected X-ray maps
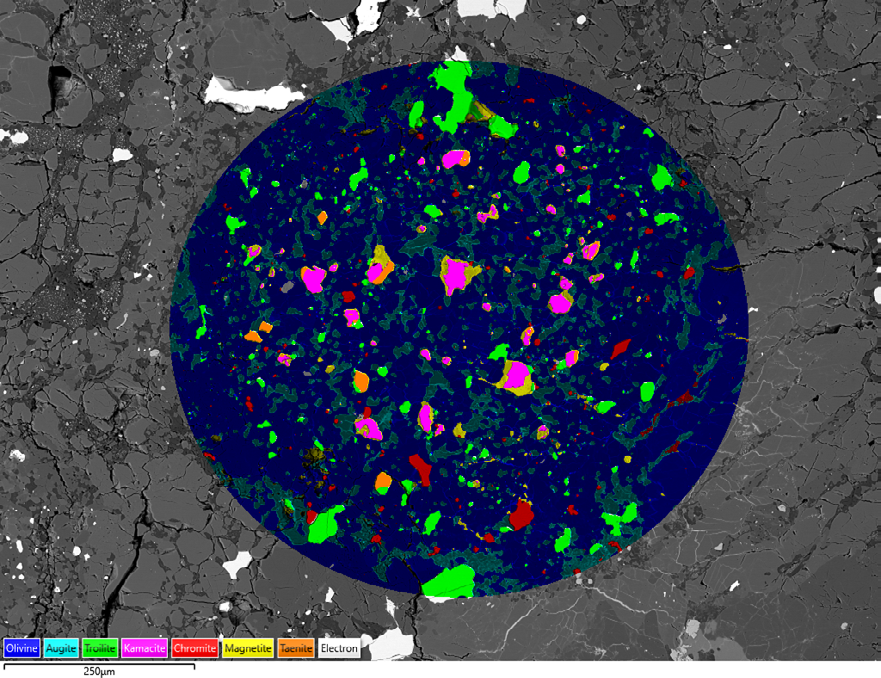
These X-ray maps can be used to produce both layered images and phase images. This summarises the phase, chemical composition and microstructure of the sample by reconstructing spectra from representative areas and interpreting the constituent elements and quantitative results. For each phase, a phase distribution image, spectrum and quantitative result are generated automatically. The resultant AutoPhaseMap for this area is shown in Figure 11. Colours are assigned to each phase to match the colours of the X-ray maps in the layered image. In this area seven phases were identified, and the Area% of each phase is shown.
The highest proportion mineral is olivine at close to 70%, followed by 19% orthopyroxene and 4.7% troilite. The proportions of kamacite and taenite are 1.7% and 0.5% respectively. In the phase distribution image, the iron-containing particles are distributed as small particles in the chondrule. Magnetite is often accompanied by kamacite and may have been formed by the oxidation of kamacite. In a few instances kamacite appears next to troilite. There are many contacts between kamacite and taenite, and they often co-exist in the same particle. This relationship between kamacite and taenite is fully in line with the characteristics of meteorites.
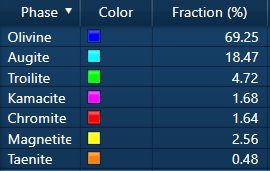
Fig 11. AutoPhaseMap composite image showing the distribution of the identified mineral phases and the area fraction of each phase.
Conclusion
Using a combination of EDS quantitative analysis, EDS mapping, and AutoPhaseMap, it is confirmed that the sample is a meteorite and it belongs to the L group of ordinary chondrites. AZtec EDS is a powerful tool that provides a robust method for mineral identification, chemical characterisation, modal calculation and classification.
References
- Field Guide to Meteors and Meteorites. Authors: Norton, O. Richard; Chitwood, Lawrence.
- The Higher Education Press iCourse Textbook: Crystallography and Mineralogy (3rd edition) (Chinese Edition), Zhao Shan Rong.

