Introduction
Glassy carbon, also referred to as glass-like carbon, is a disordered, non-graphitizing carbon material typically
produced by the pyrolysis of polymeric precursors such as phenolic resins and polyfurfuryl alcohols under controlled
atmospheres [1-7]. Unlike graphitizing carbon, glassy carbon retains its predominantly turbostratic microstructure
even after high-temperature heat treatment, resulting in a unique combination of structural disorder and exceptional
stability [1,2,6,8]. Glassy carbon has found widespread use in industrial, electrochemical, and scientific
applications because of its relatively straightforward synthesis and advantageous physical and chemical properties,
which include high thermal stability, excellent corrosion resistance, gas impermeability, low density, high hardness,
and good electrical conductivity [1-4,8-11]. Furthermore, its excellent biocompatibility and chemical inertness have
made it a promising material for biomedical devices and implantable systems [5,12,13].
Raman spectroscopy is widely recognised as one of the most powerful techniques for investigating carbon-based
materials because it provides direct insight into crystallinity, structural disorder, defects, and graphitic ordering
through characteristic spectral features such as the D, G, and 2D bands [14-17].
The aim of this application note is to demonstrate the analytical capabilities of the witec360 microscope equipped
with the Hexalight spectrometer through a series of Raman and RISE (Raman Imaging and Scanning Electron) imaging
experiments. The presented results highlight the complementary strengths of confocal Raman imaging and correlative
Raman-SEM (SEM: Scanning Electron Microscopy) analysis for the characterisation of carbon allotropes and the
visualisation of structural variations on the micro- and nanoscale.
Experimental setup for Raman imaging and correlative Raman-SEM analysis
This application note presents two complementary experiments. The first was performed under ambient conditions using
the witec360 confocal Raman microscope. The second was carried out under high-vacuum conditions using the RISE
microscope, which combines Raman imaging with scanning electron microscopy.
Both experiments used 532 nm laser excitation with the 300 mm Hexalight spectrograph equipped with a 600 g/mm and a
1800 g/mm grating. Bright-field images were acquired using either a 100x/0.9 air objective or a 100x/0.75 vacuum
objective, depending on the measurement environment.
Confocal Raman imaging of glassy carbon fibres in carbon matrix
Figure 1a shows a bright-field image of a polished cross section of glassy carbon fibres embedded in another
carbon-based material. Figure 1b presents the overlay of the colour-coded Raman image on the corresponding
bright-field image.
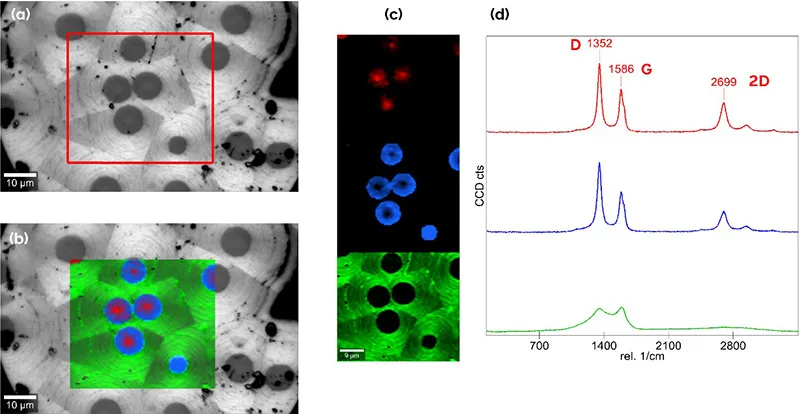
Figure 1: Raman analysis of glassy carbon fibres in a carbon matrix. Bright-field image of a cross
section through glassy carbon fibres surrounded by another form of carbon (a). Overlay of colour-coded Raman image and
bright-field image (b). Results of True Component Analysis displaying the extracted phases (c) and the corresponding
Raman spectra colour-coded (d).
The Raman image was acquired as a two-dimensional scan of 90 x 80 pixels over an area of 45 x 40 µm², generating
8,100 complete Raman spectra with an integration time of 0.2 s per spectrum.
True Component Analysis (TCA), a univariate Raman data analysis tool integrated in the WITec Suite software, was used
to identify and visualise the distribution of the different components. The software automatically detects components,
calculates average component spectra, and supports spectral demixing. The resulting component distribution is shown in
Figure 1c. The spectra shown in Figure 1d represent the colour-coded components extracted from this image scan.
Identifying carbon phases and core-shell fibre structures with Raman imaging
All spectra in Figure 1d are associated with carbon allotropes and show the characteristic D, G, and 2D Raman bands.
The red and blue spectra correspond to glassy carbon and reveal subtle spectral differences within the analysed
fibres. Their spatial distribution indicates a core-shell structure, which is shown in Figure 2c.
The small spectral variations between the red and blue components are highlighted in Figure 2b. These differences
suggest variations in the thermal history of the fibres, consistent with production-temperature effects reported in
the literature [7].
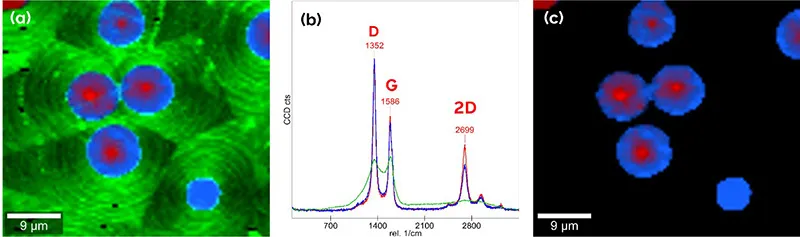
Figure 2: Raman imaging reveals core-shell structure of glassy carbon fibres. Colour-coded Raman
image (a), Raman spectra represented with the same y-scale (b), core-shell structure of the glassy carbon fibres (c).
While the Raman experiment described above resolved the structure of glassy carbon fibres themselves, the next
experiment demonstrates how correlative Raman-SEM analysis can characterise the surrounding matrix.
Raman-SEM imaging of glassy carbon fibres embedded in a SiC matrix
Figure 3 presents a correlative RISE image of carbon fibres embedded in a silicon carbide (SiC) matrix, together with
Raman spectra assigned to distinct SiC polytypes. Because Raman spectroscopy is highly sensitive to lattice bonding
and crystal symmetry, it enables differentiation of SiC polytypes through their characteristic vibrational modes. The
principal Raman features of SiC occur in two spectral regions: optical phonon modes associated with
fundamental Si-C vibrations between 700 and 1000 cm⁻¹, and folded acoustic modes below 300 cm⁻¹,
which arise from polytype-dependent stacking periodicity. The main Raman bands of SiC in association with their
crystallographic structure are summarised in Table 1 [18].
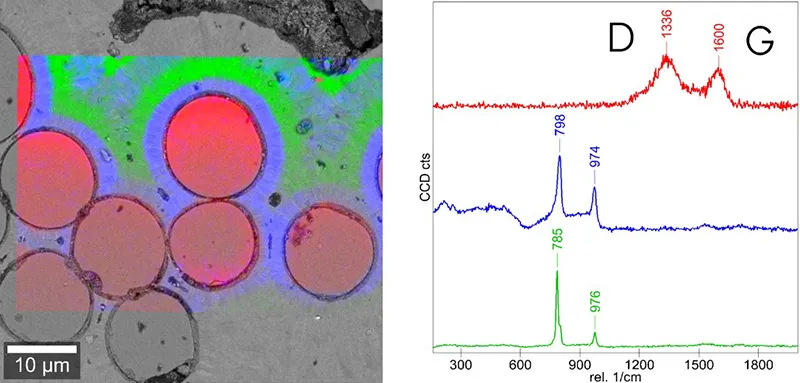
Figure 3: Raman-SEM analysis of glassy carbon fibres and surrounding SiC matrix. Colour-coded RISE
image (Raman-SEM overlay), and corresponding Raman spectra evaluated with TCA.
Table 1: Summary of the main Raman bands of SiC polytypes [18].
| Polytype |
Acoustic modes [rel. cm⁻¹] |
Transverse optical (TO) modes [rel. cm⁻¹] |
Longitudinal optical (LO) modes [rel. cm⁻¹] |
| 3C |
none |
796 |
972 |
| 4H |
204 |
776; 796 |
964 |
| 6H |
145; 236 |
767; 789; 797 |
965 |
| 15R |
167; 172; 239 |
769; 785; 797 |
965 |
The analysed fibres exhibit a homogeneous carbon-rich composition and are surrounded by at least two
spectroscopically distinguishable SiC polytypes. To resolve the local structural characteristics of the SiC phase
adjacent to the fibres, additional measurements were performed using a high-resolution 1800 grooves/mm grating.
Figure 4 shows high-resolution SEM images acquired using backscattered electron (BSE) and secondary electron (SE)
detection modes, respectively. The BSE-SEM image reveals a needle-like region approximately 2.6 µm in width
surrounding the carbon fibres (Figure 4a), whereas the SE image shows a bright annular feature with a width of
approximately 1.8 µm (Figure 4b). The corresponding Raman spectra and Raman image are shown in Figure 4c and d. The
Raman image indicates that the SiC adjacent to the carbon fibres is spatially separated into two concentric regions,
represented by the red and blue spectral components. The RISE overlay in Figure 4e correlates these Raman-derived
phases with the BSE-SEM contrast and suggests that the needle-like region contains two SiC states, most likely
associated with stress-induced variations in 6H-SiC, as evidenced by the Raman peak shift shown in Figure 4f. The
red-shifted Raman component is consistent with the bright annular feature observed in the SE-SEM image in Figure 4g.
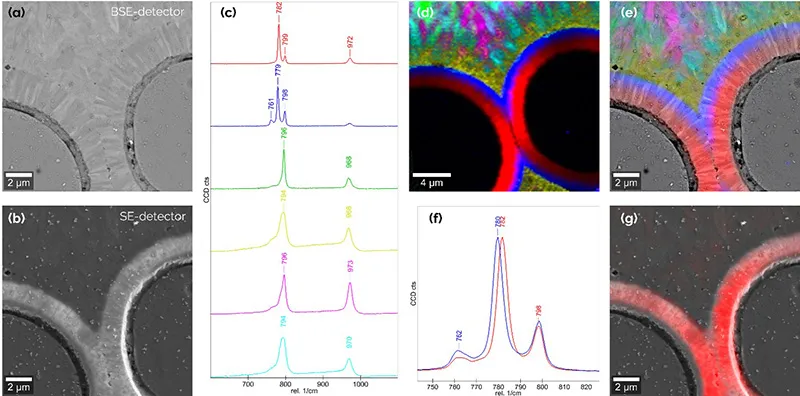
Figure 4: Detailed RISE analysis of the SiC matrix surrounding glassy carbon fibres. SEM images
acquired with the BSE (a) and SE (b) detector; Raman spectra (c) and colour-coded Raman image (d); RISE image as
overlay of BSE and Raman image (e); Raman peak shift around 780 rel. cm⁻¹ (f); and overlay of the red shifted SiC with
the SE-SEM image (g).
Key findings from Raman and RISE imaging of glassy carbon composites
The results presented in this application note demonstrate the value of confocal Raman imaging and correlative RISE
microscopy for the detailed characterisation of carbon fibre-based composite materials. Using the witec360 microscope
with Hexalight spectrometer, Raman imaging resolved subtle spectral variations within glassy carbon fibres and
revealed a core-shell structure that is not readily accessible from conventional optical contrast alone.
The combination of Raman spectroscopy with SEM in the RISE microscope further extended the analysis by directly
correlating molecular and structural information with high-resolution surface morphology. This enabled the
differentiation of SiC polytypes surrounding the carbon fibres and the visualisation of local spectral shifts, most
likely related to stress-induced variations in the SiC matrix.
Together, these measurements show that Raman and RISE imaging provide complementary, non-destructive insight into the
composition, microstructure, and local variations of complex carbon-based materials. The approach is well suited for
materials development, failure analysis, and quality control where spatially resolved chemical, structural, and
morphological information is required from the same region of interest.
References
- Jenkins, G.M.; Kawamura, K. Polymeric Carbons: Carbon Fibre, Glass and Char. Cambridge University Press,
1976.
- Franklin, R.E. Crystallite growth in graphitizing and non-graphitizing carbons. Proc. Royal Soc. A
1951, 209, 196-218. https://doi.org/10.1098/rspa.1951.0197
- Fitzer, E. The future of carbon-carbon composites. Carbon 1987, 25, 163-190.
https://doi.org/10.1016/0008-6223(87)90122-8
- Thrower, P.A.; Rand, B. Chemistry and physics of carbon. Marcel Dekker, 1989.
- Kotlarek, D.; et al. Glassy carbon as a biocompatible material for biomedical applications. Materials Science
and Engineering C 2015, 52, 328-336.
- Harris, P.J.F. New perspectives on the structure of graphitic carbons. Critical Reviews in Solid State and
Materials Sciences 2005, 30, 235-253. https://doi.org/10.1080/10408430500406265
- Jurkiewicz, K.; et al. Structure of glassy carbon after high-temperature treatment. Journal of Materials
Science 2018, 53, 3509-3523. https://doi.org/10.1007/s10853-017-1767-3
- Harris, P.J.F. Fullerene-related structure of commercial glassy carbons. Philosophical Magazine
2004, 84, 3159-3167.
- McCreery, R.L. Advanced carbon electrode materials for molecular electrochemistry. Chemical Reviews
2008, 108, 2646-2687. https://doi.org/10.1021/cr068076m
- Noda, T.; Inagaki, M.; Yamada, S. Glass-like carbon. Journal of Non-Crystalline Solids
1969, 1, 285-302.
- Inagaki, M.; Kang, F. Materials Science and Engineering of Carbon. Butterworth-Heinemann,
2014.
- Roy, R.K.; Lee, K.R. Biomedical applications of diamond-like carbon coatings. Journal of Biomedical Materials
Research Part B 2007, 83B, 72-84.
- Grill, A. Diamond-like carbon coatings as biocompatible materials. Diamond and Related Materials
2003, 12, 166-170.
- Ferrari, A.C.; Robertson, J. Interpretation of Raman spectra of disordered and amorphous carbon. Physical
Review B 2000, 61, 14095-14107. https://doi.org/10.1103/PhysRevB.61.14095
- Ferrari, A.C.; Robertson, J. Raman spectroscopy of amorphous, nanostructured, diamond-like carbon, and
nanodiamond. Philosophical Transactions of the Royal Society A 2004, 362,
2477-2512. https://doi.org/10.1098/rsta.2004.1452
- Sadezky, A.; et al. Raman microspectroscopy of soot and related carbonaceous materials. Carbon
2005, 43, 1731-1742. https://doi.org/10.1016/j.carbon.2005.02.018
- Dresselhaus, M.S.; Jorio, A.; Saito, R. Characterizing graphene, graphite, and carbon nanostructures by Raman
spectroscopy. Annual Review of Condensed Matter Physics 2010, 1, 89-108.
- E. Cala, et al.; Phys. Chem. Chem. Phys. 2025, 27.

