Introduction
Crucial tasks in forensics include the microscopic analysis of very small objects in order to accurately verify the source of specific compounds of such sample, or to compare the characteristics of several samples. Confocal Raman Imaging is a very effective tool for such analysis as it provides information on the chemical composition as well as the spatial distribution of the components. The samples typically do not require specific sample preparation and remain unaltered for further investigations with other methods since Raman Imaging is a non-destructive, non-contact and non-contaminating analysis technique.
Experimental Methods
All experiments were performed with the confocal Raman microscopes of the alpha300 R or alpha500 R series. The alpha300 microscope series is optimized for high resolution imaging of samples and is able to combine several analytical measuring techniques in one instrument such as: diffraction-limited confocal microscopy, chemically-sensitive Raman spectroscopy and cantilever based scanning probe microscopy, including AFM and SNOM. Using these instruments it is possible to analyze the same sample position with various measuring techniques sequentially or even in parallel (Raman and AFM). The alpha300 R Plus and the alpha500 microscope series add automation and large scan area measuring capabilities. The confocal Raman microscope can be equipped with a variety of excitation lasers. All measurements were performed using an UHTS300 (ultra-high-throughput spectrometer) and back-illuminated CCD cameras. The distribution of chemical species on the sample was obtained in Raman spectral imaging mode. In this imaging mode a complete Raman spectrum is recorded at every imaging point, leading to a 2D array of Raman spectra. By extracting individual features such as Raman peak intensity, peak width or peak position from the recorded 2D arrays of spectra, Raman images can be calculated displaying a variety of information contents. Furthermore, fitting algorithms can be employed to extract additional images from the recorded 2D arrays of Raman spectra. The combination of such images allow the illustration of the distribution of various compounds in one image. The illustration colors are coded in the same way for the corresponding spectra. The acquisition time for a Raman spectrum within a 2D spectral array was only a few milliseconds or 10s of milliseconds, thus allowing the acquisition of thousands of Raman spectra within minutes.
Residues of Explosives on a Fingerprint
In the following study Confocal Raman Imaging was applied to the detection of explosives residues on a fingerprint which could be a hint that the person most recently handled such material. A fingerprint on glass was scanned using the large area scanning capabilities of the alpha300 R+ system. Among the acquired spectra, three spectra related to explosive materials could be easily detected as shown in Fig. 1a (red spectrum: Sulfur, blue spectrum: amorphous carbon, turquoise: Nitrate). The fluorescence signal was used to generate an image of the fingerprint outline (Fig. 1b) with the location of the explosives residues additionally shown in the same color code as the spectra in Fig. 1a. The imaging of a complete fingerprint allows the identification of an individual person and the co-location of explosives compounds strongly suggests that this person was in contact with explosive materials.
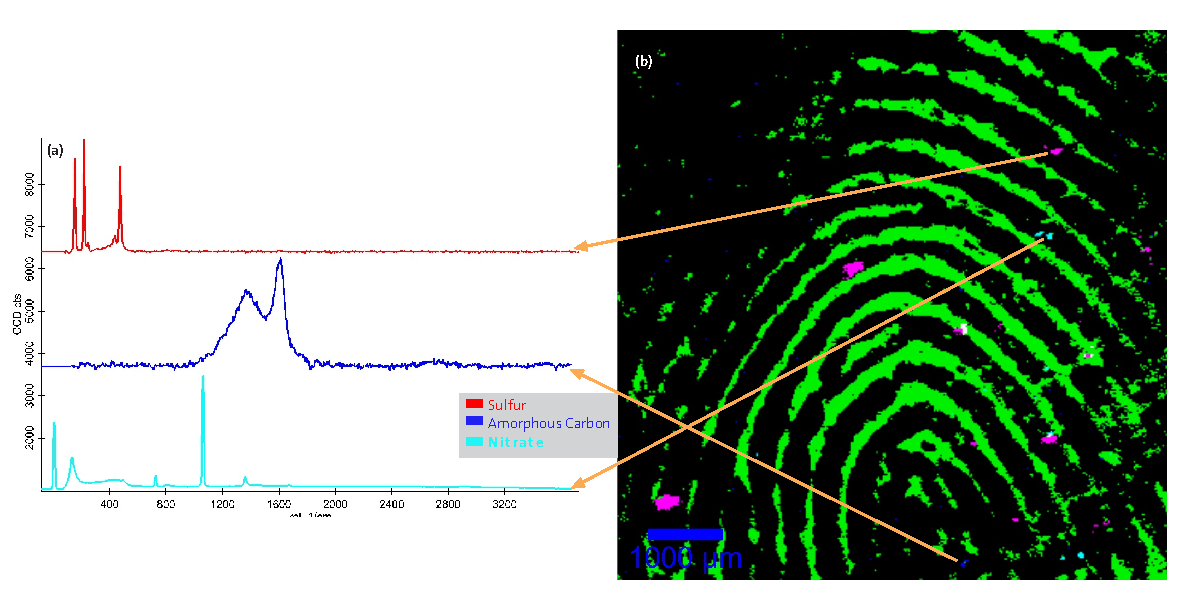
Fig. 1 — (a) Typical Raman spectra of explosive compounds (Sulfur, Amorphous Carbon, Nitrate) as detected in the large area Raman scan of a human fingerprint. (b) Raman image of the fingerprint with the location of the small explosives residues.
Writing and Printing on Paper
"Who signed first? – And with which pen?" Two common questions in forensic document forging investigation processes. Confocal Raman imaging can provide evidence of the use of various ballpoint pen marks on paper and the order in which these inks (pastes) were applied to the paper. Fig. 2a shows a video image recorded at the intersection of two different ballpoint pen marks. Paste 1 was applied on the right side of the video image and paste 2 on the left side. The possibility of an overlap of these two pastes cannot be excluded, however this is not evident from the video image alone. The area marked with the red frame (50x50 µm²) was scanned in Raman spectral imaging mode by recording an array of 128x128 complete Raman spectra with an integration time of 100 ms/spectrum. From the array of spectra, three different Raman spectra were calculated. At some surface areas only luminescence could be detected (not shown as a spectrum), whereas other areas showed the unique Raman spectra presented in Fig. 2b. These two spectra show only very small differences of which some are highlighted with arrows in the figure. In the color-coded Raman image presented in Fig. 2c, blue denotes the luminescent areas while the distribution of the two ballpoint-pastes are represented in red and green. An area where both pens can be seen is clearly visible. To prove the order in which these ballpoint pens were applied to the paper, a depth scan (x-z scan) along the black line in the video image (Fig. 2a) was performed. An array of 128x128 complete Raman spectra was acquired over 90 µm in the x-direction and 50 µm in the z-direction with an integration time of 100 ms/spectrum. The distribution along the depth profile of the two ballpoint pens pastes is shown in Fig. 2d, using the same color-code as for Fig. 2c. This depth profile clearly shows that the red marked paste was applied on top of the green marked paste, thus showing the order in which these pastes were applied to the paper. This result can only be obtained by using a high confocal resolution Raman imaging setup.
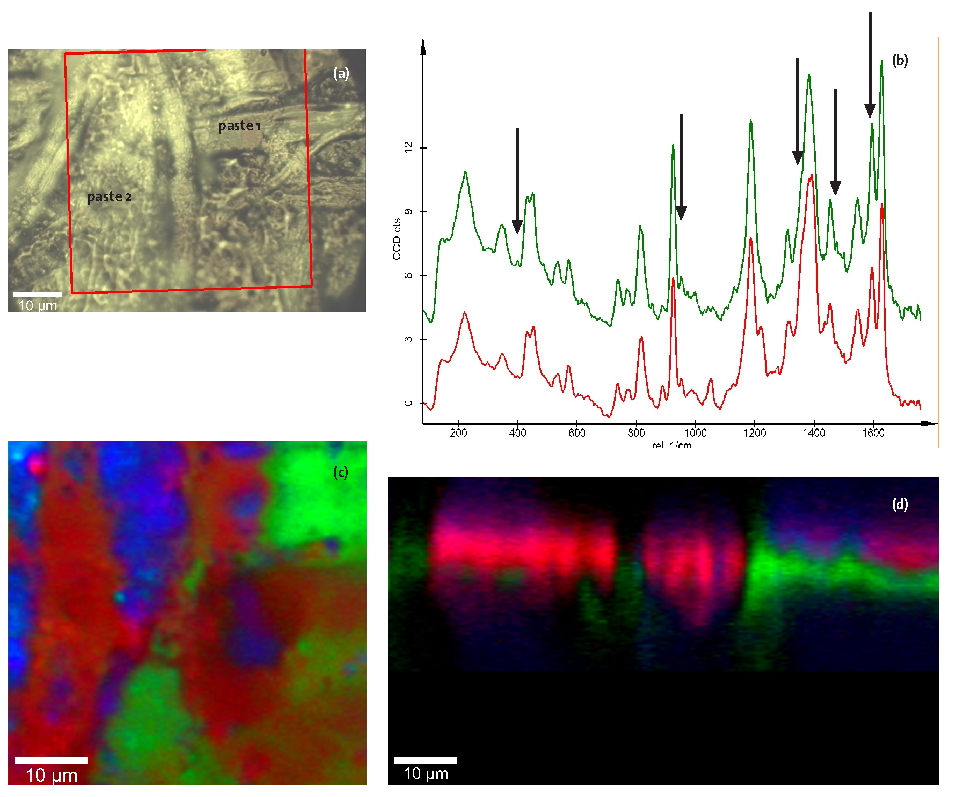
Fig. 2 — Confocal Raman imaging of ballpoint writing on paper. Video image (a), evaluated Raman spectra (b), color-coded Raman image recorded from the paper surface, image area 50x50 µm², 128x128 pixels, integration time: 100 ms/spectrum (c), and color-coded depth profile, image area 90x50 µm², 128x128 pixels, integration time: 100 ms/spectrum (d). The ballpoint writing is shown in red and green in the images.
Ballpoint Pen and Printer Ink Analysis
In the following examples a combined printing and ballpoint mark on paper is analyzed to show that by using Raman imaging it is possible to distinguish printer ink from ballpoint pen ink. These experiments require the analysis of large sample areas in the range of several millimeters and therefore the alpha500 R microscope equipped with a green laser and a 50x air objective (NA = 0.5) was used. In a first measurement the chemical composition of the printer ink distributed on the paper was examined. A sample area of 3x2 mm² was imaged in Raman spectral imaging mode by acquiring an array of 150x150 Raman spectra with an integration time of 160 ms/spectrum. From this array three different spectra were calculated as shown in red and yellow color in Fig. 3a, whereas the third spectrum (not presented) showed strong fluorescence represented as green spots in Fig. 3b. The red spectrum is characteristic for the coated printer paper, whereas the yellow spectrum corresponds to the printing ink used to produce a yellow printed line as shown in the color-coded Raman image in Fig. 3b. Additionally, in the printer ink, strongly fluorescent particles (represented in green in Fig. 3b) could be detected, which are distributed randomly over the printed line. In a second experiment, a ballpoint pen line was drawn across the border between the printed line and plain paper. A large area scan of 0.8x1.3 mm² was performed over the border between the paper, printed line and ballpoint pen writing. The distribution of paper, printed line and ballpoint pen mark is shown in Fig. 3c. The ink of the ballpoint pen (blue spectrum in Fig. 3a and blue color in Fig. 3c) shows significant spectral differences compared to the ink used in the printer.
The measurements presented in this section show that confocal Raman imaging can contribute to the analysis of forensic material, providing information regarding printing material used and the order in which they were applied.
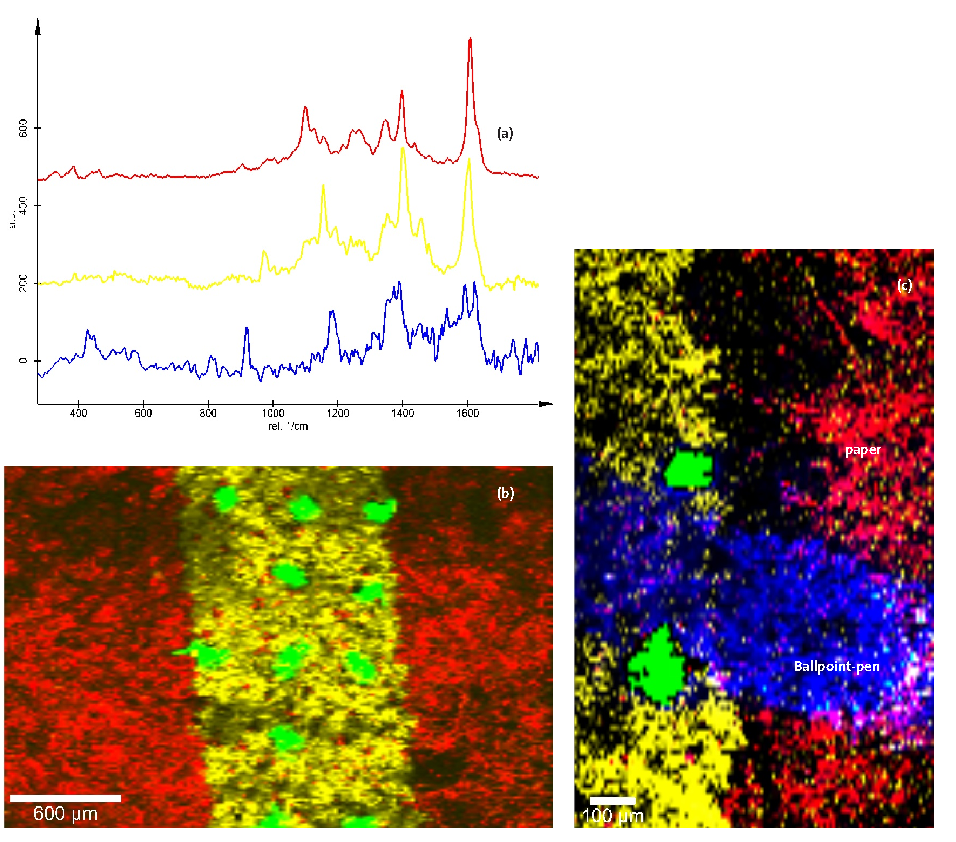
Fig. 3 — Confocal Raman imaging of printing and ballpoint writing on paper: evaluated Raman spectra of paper (red), printer ink (yellow) and ballpoint ink (blue) (a), color-coded Raman image recorded from the paper surface after printing, image area 3x2 mm², 150x150 pixels, integration time: 160 ms/spectrum (b), and color-coded Raman image after printing and writing, image area 0.8x1.3 mm², 128x128 pixels, integration time: 160 ms/spectrum (c).

