What is X-ray Shadowing and How Does It Limit SEM-EDS Analysis
The study focuses on the chemical characterisation of particulate material captured by an in-line liquid
chromatography filter, where the recessed filter position and surrounding housing obstruct the X-ray path to a
standard inclined EDS detector (Figs. 1&2). In these situations, a backscattered electron and X-ray (BEX) detector
provides an alternative analytical approach, making in-situ analysis possible without destructive disassembly. This is
particularly valuable for filter inspection, where identifying the composition and morphology of retained particles
can help diagnose contamination pathways, protect instrument performance, and support quality control in highly
regulated industries such as pharmaceuticals.
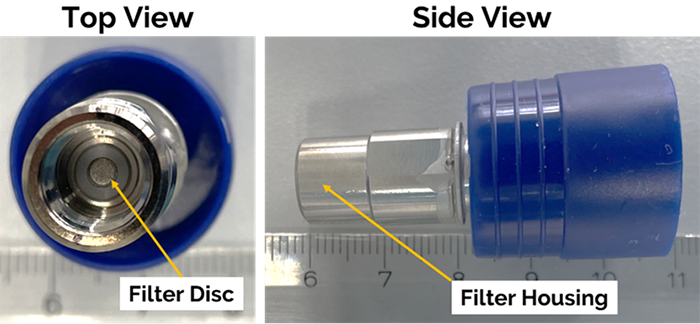
Figure 1: Photographs displaying the filter and housing analysed by BEX. Note from the top view that
the filter disc is significantly lower than the surrounding housing, which leads to X-ray shadowing when using a
conventional EDS detector.
How BEX Overcomes the Geometry Limitation
Specifically, a BEX detector offers a unique solution to this problem because of its horizontal insertion beneath the
SEM pole piece (Fig. 2). As a result, the X-ray line of sight is not obstructed by the filter housing, unlike with EDS
detectors that are typically inclined at 35° (Fig. 2). This means that high-quality in-situ chemical characterisation
is possible within the SEM for many samples with challenging geometry, without the need to remove the filter housing,
preserving the samples integrity.
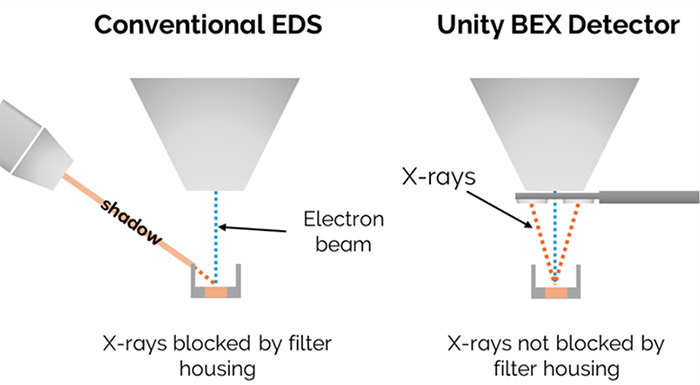
Figure 2: Diagrams displaying the shadowing effect caused by using an inclined conventional EDS
detector by comparison with a BEX detector inserted horizontally beneath the pole piece.
In-situ Analysis of Retained Particulates
Operated at beam conditions of 20 kV and 5 nA, the BEX detector was able to identify Fe- and Si-rich particulates
captured within an in-line liquid chromatography filter after just 40 seconds of acquisition time (Fig. 3).
Particulates as small as 1.7 µm were easily identified from a single high-resolution (8K) map (Fig. 3C). The
composition of these particles suggests that they originate from the physical breakdown of Si-rich glassware and
mechanical wear of the system’s metallic hardware.
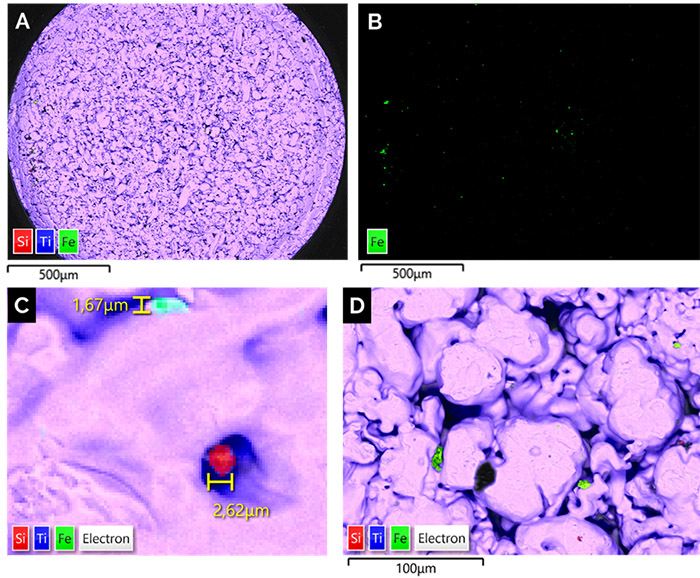
Figure 3: BEX analysis of particulate contamination retained within an in-line filter. A) Low
magnification 8K BEX map of the filter area, approximately 1 mm wide, captured in 40 seconds. B) Fe X-ray map acquired
using the BEX detector, extracted from the multilayer elemental and BSE dataset shown in A. C) Higher-magnification
view from map A showing Si-rich particulate contamination. D) Higher-magnification view from map A showing Fe-rich
particulate contamination, including particles several µm in size.
Conclusions
This case study highlights how samples with challenging geometry can prevent effective chemical characterisation by
SEM-EDS because of shadowing. By overcoming this limitation through horizontal insertion, the BEX technique enables
rapid compositional analysis in situations where conventional EDS struggles. As a result, the origin of particulate
contamination within a high-performance liquid chromatography system can be identified without destructive sample
preparation and risk of sample contamination.

