Application Notes
Eliminating Sample Heating During Common NMR Measurements
Published: 03 Nov 2026 · Last updated: 03 Nov 2026
This Application Note was created in collaboration with Green Imaging Technologies

Introduction
Nuclear Magnetic Resonance (NMR) measurements such as T2 distributions, T1-T2 and T2-diffusion maps are employed to derive porosity, wettability, fluid types and other properties. These measurements are derived using the Carr-Purcell-Meiboom-Gill (CPMG) NMR pulse sequence [1]. This pulse sequence employs a train of radio frequency pulses which probe the exponential decay of the NMR signal. In order to probe the fastest decays, the pulses at the beginning of the CPMG pulse train must be close together. For slower decays, the pulse train must be long. The large number of radio frequency pulses will heat the sample through inductive heating which will alter the NMR decay itself. By smartly spacing the RF pulses, all the decays can be measured with far fewer pulses thus significantly reducing the heating.
In a typical CPMG sequence, the pulses in the train are linearly spaced. This results in trains with many closely spaced pulses, leading to heating of the sample. Heating is an issue because as the sample's temperature increases, its NMR signal decreases. This can lead to inaccuracies in the porosity derived from the NMR data. In addition, the petrophysical property being measured may be temperature dependent and thus there is no control of an important property. For porosity, we have explored the degree of inaccuracy and have found that heating can lead to changes in retrieved NMR porosity of approximately 10% in both bulk fluid and core samples. We have also explored the effect of salinity of the sample fluid.
Key Findings
- Traditional CPMG sequences can heat samples leading to errors in the porosity of up to 10%.
- The NMR response often includes a temperature dependency which will lead to difficulties in interpretation if the temperature is changed by the measurement itself.
- Log spaced CPMG eliminates sample heating by reducing number of pulses by up to 2 orders of magnitude.
- Log spaced CPMG measures the same decay response with far greater accuracy (porosity variation < 1%) and no temperature effects.
Method
One method to eliminate the unwanted heating of samples is to reduce the number of RF pulses by logarithmically spacing the echoes (Figure 1). This logarithmically spaced train will maintain the closely spaced pulses at the beginning of the sequence necessary to probe the smallest pores, while decreasing the density of the pulses as the train gets longer. This leads to a reduction in the total number of pulses and therefore a reduction in the heating of the sample. We have implemented these logarithmically spaced CPMG sequences and will show that these sequences still accurately reproduce the NMR measurements for all samples, while eliminating sample heating.
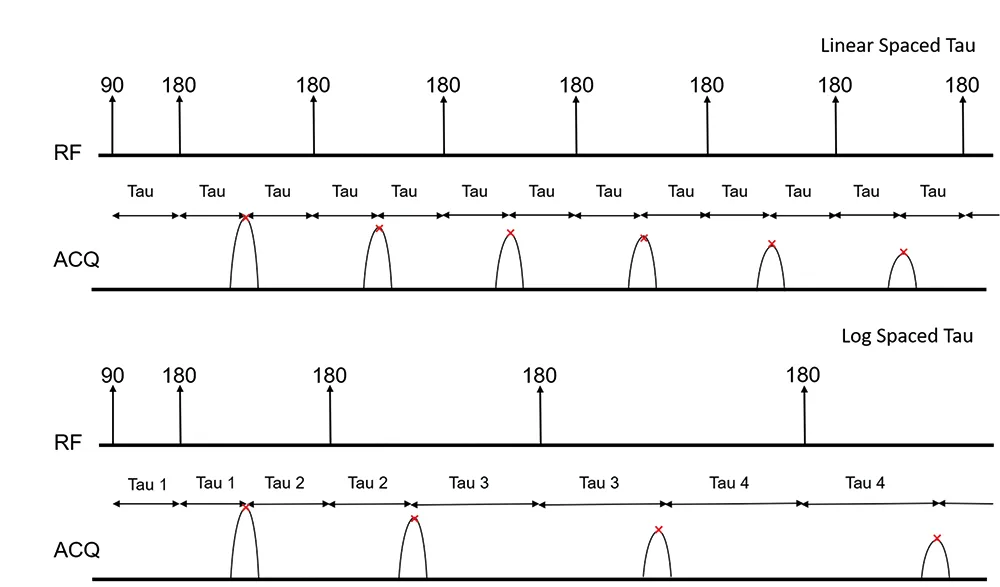
Fig. 1 — Linear vs. log spaced CPMG sequences. In the linear sequence the spacing between each 180 degree RF pulse is equal (Tau). In the logarithmic spaced sequence the spacing between each RF pulse grows exponentially.
Experiments
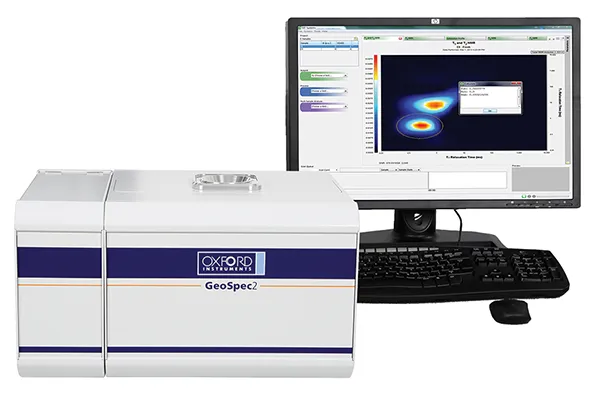
All the NMR experiments were carried out using an Oxford Instruments GeoSpec 2+/75 rock core analyser [2]. The pulse sequence development and data acquisition were performed using Green Imaging Technologies App Builder software [3]. Three sets of experiments were carried out to explore reducing heating during NMR measurements by employing a log spaced CPMG sequence. The first set of experiments explored the ability of the log spaced pulse sequence to accurately reproduce pore size distributions. The second set of experiments were designed to calibrate the change in NMR volume observed due to sample heating by the CPMG vs. the actual change in temperature of the sample. The final set of experiments explored the effect of heating of different types of samples (bulk vs. core and 2% vs. 20% brine saturation) via CPMG pulse sequences and examined to what degree log spaced sequences can reduce this heating.
To properly quantify the effects of heating by the CPMG sequences in experiments two and three, the volumes retrieved from the T2 distributions needed to be plotted as a function of time. To do this, new pulse sequences were developed where the CPMG T2 distribution measurement was put inside a loop. Each time through the loop, the CPMG pulse sequence was run several times. This raw NMR decay data was then averaged and a T2 distribution created from this averaged data. The measured volume was then retrieved by summing the area under the T2 distribution. The volume was then saved to a file along with a date/time stamp for each volume measurement. This data was then used to plot volume versus time. Changes in retrieved volume over time were examined as the sample was heated by the CPMG sequence. The same looping pulse sequence was used to retrieve the data of interest with both the log and linear CPMG pulse sequences.
Experiment 1: Pore Size Distribution Correlation
To test the ability of the log spaced CPMG sequence to accurately reproduce pore size distributions, three glass filled samples (2.5 cm diameter x 1 cm high) were stacked into the magnet. Each sample contained approximately 2.5 ml of 2% KCl brine. Each sample was doped with different amounts of copper sulfate which is paramagnetic and causes the principal T2 component for each sample's distribution to be shifted. The higher the copper sulfate concentration, the lower the peak T2 value. The three samples employed had peak T2 values at approximately 0.5 ms, 10 ms and 100 ms. When the three samples were stacked together in the magnet, they produce one combined T2 distribution with three distinct peaks. This distribution was then probed with both the linear and log CPMG sequences.
Figure 2 shows the comparison of the T2 distribution retrieved for the linear CPMG sequence (Figure 2 – blue trace) to that retrieved from the log spaced CPMG (Figure 2 – red trace). Table 1 shows the NMR parameters employed for both the linear and log spaced CPMG sequences employed. As mentioned in the experimental section, this T2-distribution was retrieved from three samples with three different peak T2 values stacked on top of each other in the magnet. Figure 2 shows that there is excellent agreement between the distributions derived from the linear CPMG sequence as compared to the log CPMG sequence. The total volume of the three samples derived from the log and linear spaced sequences differs by less than 1%.
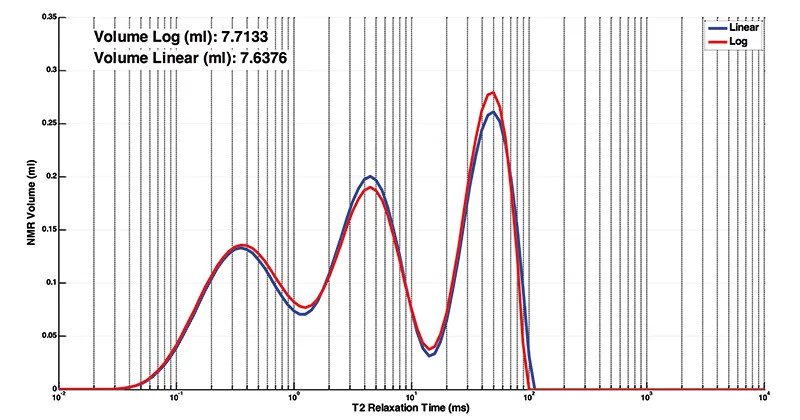
Fig. 2 — Comparison of T2 distributions retrieved from the linear spaced CPMG (blue trace) and log spaced CPMG (red trace) pulse sequences, retrieved from three samples with three different peak T2 values stacked on top of each other in the magnet.
Table 1: NMR parameters for comparison of performance of log vs linear spaced CPMG
| Log Spaced CPMG | Linear Spaced CPMG | |
| Tau (μs) | Log spaced between 100 → 1380 | 100 |
| Number of Echoes | 512 | 2500 |
| Max T2 (ms) | 100 | 100 |
| Recycle Delay (s) | 0.5 | 0.5 |
| Number of Scans | 16 | 16 |
| P90 (μs) | 11.22 | 11.22 |
| P180 (μs) | 22.42 | 22.42 |
| NMR Resonance (MHz) | 2.457 | 2.457 |
Experiment 2: Calibration of NMR Volume to Temperature Variations
The second set of experiments set out to quantify the effect of CPMG heating by tracking the volumes measured as a function of time. As mentioned earlier, as a sample heats there will be a decrease in the volume measured from the NMR data. The blue dots in the upper panel of Figure 3 show the associated change in NMR volume as a bulk 2% KCl sample is probed as a function of time. The measured volume clearly drops from approximately 17.3 ml to 16.7 ml during the experiment. It should be noted that the scatter in the blue dots is associated with instability in the NMR data and is not truly caused by variations in temperature. The NMR volume data can also be plotted as a percentage change (Figure 3 – lower panel – blue dots). Also shown in the upper panel of Figure 3 is the sample temperature as a function of time. This data was recorded simultaneously with the NMR volume using an infrared thermometer and shows that the sample increases in temperature from approximately 27.50 C to 34.75 C.
As expected, there was clearly an inverse correlation between the temperature of the sample and the observed NMR signal or volume. Specifically, the NMR signal is tied to temperature via a Boltzmann distribution. Therefore, the observed sample temperatures can be employed to predict the change in observed NMR volume.
This was completed for the temperature data recorded and the predicted percent change in NMR volume is plotted as the red dots in the lower panel of Figure 3. As can be seen there is good agreement between the measured change in NMR volume and predicted change in NMR volume. Any difference between the predicted and measured change in NMR volume can be attributed to the fact that the IR thermometer measures the surface temperature of the brine whereas the NMR measurement probes the entire bulk volume. The surface temperature could be cooler than the average temperature of the bulk sample as it is cooled by the air above the sample.
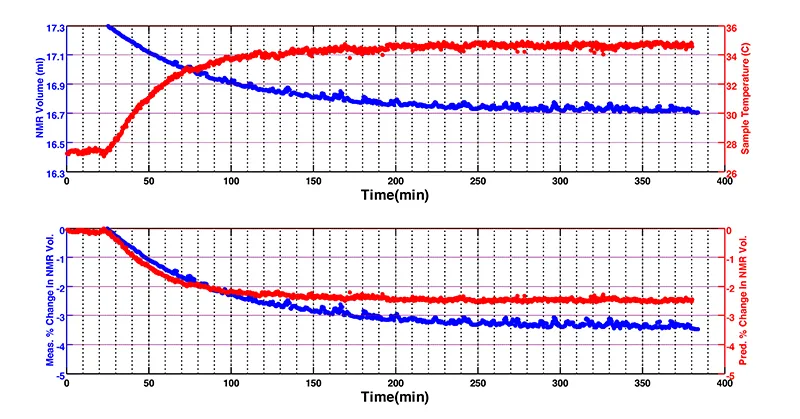
Fig. 3 — NMR volume of a bulk 2% KCl sample (blue dots – upper panel) measured as a function of time by a linear CPMG sequence. The temperature of the bulk sample (red dots – upper panel) was also logged simultaneously to the NMR measurement with an infrared thermometer. The lower panel shows the NMR volume plotted as a percent change (blue dots). The red dots in the lower panel are the percent change in NMR volume as predicted via the Boltzmann distribution using the temperature of the bulk sample.
Experiment 3: Log Versus Linear CPMG Heating Changes
Once we were confident that the observed changes in NMR volume accurately reflected heating of the samples by the CPMG sequence, we began to study sample heating with both the log and linear CPMG sequences on various sample types. Table 2 summarizes the NMR parameters employed for the log and linear CPMG pulse sequences employed.
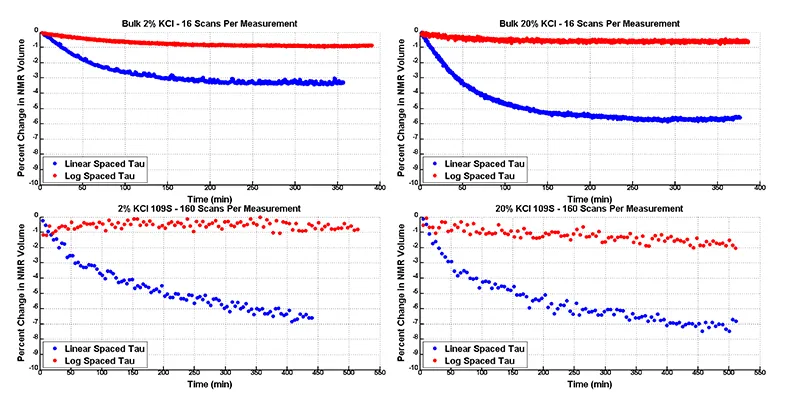
Fig. 4 — Plots of percent change in NMR volume measured with both the linear spaced CPMG pulse sequence (blue trace) and the log spaced pulse sequence (red trace). The log spaced CPMG sequence clearly reduces heating for both bulk samples (upper two panels) and saturated sandstone samples (lower two panels).
Figure 4 compares the percent change in NMR volume measured with the log and linear CPMG pulse sequences for the samples tested (Bulk 2% KCl, Bulk 20% KCl, sandstone saturated with 2% KCl, sandstone saturated with 20% KCl). For each of the samples, there is clearly more change in the volume measured for the linear CPMG sequence as compared to the log sequence. For example, for the upper right panel of Figure 4 the percent change in the measured NMR volume is approximately 7% for the linear CPMG sequence (blue dots). Conversely a percent change of only approximately 1% for the log CPMG sequence (red dots) is observed.
It should be noted that there remains a small change in the NMR volume measured by the log CPMG sequence. This indicates that despite having fewer echoes then the linear CPMG sequence, the log sequence still heats a sample to a certain degree. This heating however amounts to only approximately 1% change in the NMR volume measured.
The linearly spaced CPMG data presented in Figure 4 also allows interesting conclusions to be drawn on the difference in sample heating between bulk vs core samples and the effect of salinity on sample heating. Firstly, if we compare the linearly spaced CPMG data (blue dots) in the upper two panels of the figure, we see that the higher salinity bulk sample heats more than the lower salinity sample (7% reduction in NMR volume for higher salinity sample vs. 4% reduction in NMR volume for lower salinity sample). This is expected because the increased salt concentration of 20% KCl brine lowers the specific heat capacity of the water allowing it to reach a higher temperature as compared to the 2% KCl brine. The same comparison of salinity for the core samples (Figure 4 – lower panels – blue dots) shows that again when saturated with the higher salinity brine the core sample heats more than when it saturated with the lower salinity brine. (8% reduction in NMR volume for higher salinity sample vs. 7% reduction in NMR volume for lower salinity sample). The effect however is not as pronounced as with the bulk samples.
Table 2: NMR parameters for study of heating by CPMG sequences in pore size distribution measurements
| Bulk KCl Samples (2% and 20%) | KCl Saturated (2% and 20%) Sandstone Sample | |||
| CMPG | Log | Linear | Log | Linear |
| Tau (μs) | Log spaced between 50 → 1795 | 50 | Log spaced between 50 → 1795 | 50 |
| # of Echoes | 512 | 5000 | 512 | 5000 |
| Max T2 (ms) | 100 | 100 | 100 | 100 |
| Recycle Delay (s) | 0.75 | 0.75 | 0.75 | 0.75 |
| # of Scans | 16 | 16 | 160 | 160 |
| # of Meas. | 1000 | 1000 | 100 | 100 |
Conclusion
This paper presents results showing that the linearly spaced RF pulses in CPMG sequences (employed in T2 distributions and T1-T2 maps) can deposit excess energy into samples leading to unwanted heating. This heating can lead to inaccuracies in the measurements retrieved from the NMR data. This work has shown that depending on the type of sample (bulk vs sandstone core), the pulse parameters employed and the salinity of the brine, heating can lead to a discrepancy of up to 10% in the pore volume or porosity retrieved from T2 distributions.
A new pulse sequence was presented which eliminates the heating of samples by the many pulses in a linearly spaced CPMG pulse sequence. This new pulse sequence employs logarithmically spaced pulses. This new sequence maintains the closely spaced pulses at the beginning of the sequence necessary to probe the smallest pores while decreasing the density of the pulses as the train gets longer. This leads to a reduction (by as much as two orders of magnitude) in the total number of pulses necessary to accurately probe the exponential decay of the NMR signal and therefore a reduction in the heating of the sample. This work has shown that this new sequence can accurately reproduce T2 distributions and retrieve correct pore volumes from these distributions. The work also shows that the log spaced pulses in this modified CPMG sequence lead to no unwanted heating of the sample.
References
- Meiboom, S. and Gill, D., "Modified Spin‐Echo Method for Measuring Nuclear Relaxation Times", Review of Scientific Instruments (1958), 29, 688–691
- Geo-Spec 2-75 User Manual, Version 1.8, Oxford Instruments.
- GIT App Builder User Manual, Version 1.1, Green Imaging Technologies.
For Further Information
- M. Dick, D. Green, D. Veselinovic, "Reducing Sample Heating During NMR Measurements", Society of Core Analysts Annual Symposium, Pau France, 2019.
- M. Dick, D. Green, D. Veselinovic, "Accurate Pore Size Measurement Via NMR On Unconventionals", Unconventional Resources Technology Conference, Colorado USA, 2019.