Introduction
Advanced steels with high strength and good ductility are increasingly required for automotive components. They maximize safety by improving crashworthiness while reducing weight to improve fuel economy. Achieving these goals has driven the development of a new generation of lightweight steels with high strength and high ductility but relative low price [1].
Understanding microstructure is fundamental to producing steels with specific mechanical properties for these automotive applications. By monitoring microstructure it is possible to control and optimise the steel processing conditions for every step of production.
The integration of EBSD & EDS in the AZtec platform is a powerful microanalytical solution for monitoring microstructure, aiding in understanding the relationship between materials processing, microstructure and performance.
The following application example is a high strength lightweight steel, from Baosteel Test Centre Shanghai, China. This steel was specifically developed for use in high impact zones. The microstructural characterisation focused on:
- Phase distribution — Phase fraction and phase distribution affect steel mechanical properties and corrosion resistance.
- Texture determination — Texture has significant effect on formability and mechanical properties of steel.
- Grain Size Characterisation — Grain size strongly impacts yield strength and hardness of steel.
- Substructure and Strain distribution — Substructure and local deformation are important in understanding subgrain formation which is important in grain size refinement.
- Precipitate identification — Precipitates result from alloying: inhibiting grain boundary mobility and controlling grain size which increases the yield strength.
Data Collection
A cross-section of a processed sheet was examined with the AZtecSynergy microanalysis software using a NordlysMax3 EBSD detector and an X-Max 80 EDS detector.
Initially simultaneous EBSD & EDS data were collected automatically from 51 continuous fields over a 6.8 mm x 0.9 mm area. The multiple fields were montaged together giving an overview of the sample, highlighting trends in the microstructure. More detailed analysis was also conducted from individual fields. AZtec Data Analysis was used to characterise the steel microstructure.
Results
1. Phase Distribution
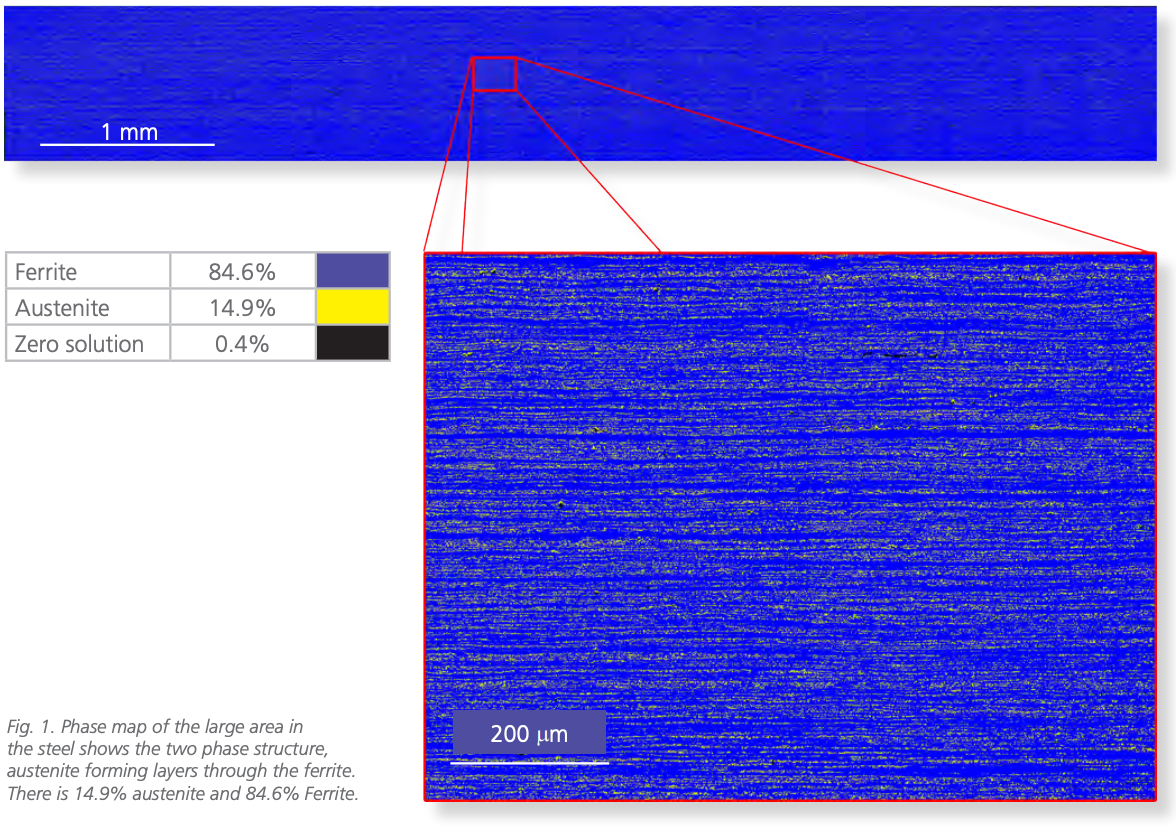
Fig. 1 shows a map of the complex two phase structure in the steel, with austenite forming layers through the ferrite. The austenite phase fraction, controlled by both the Al content and the heat treatment, is 15%.
This retained austenite plays an important role in determining the strength, toughness and hardness of the steel. It can transform into ferrite through further deformation and this transformation during impact is beneficial in improving the strength of the steel. In this example an accurate measure of the austenite fraction in the microstructure was required for optimising the processing conditions of the steel to obtain the desired mechanical properties.
2. Texture
Fig. 2 shows an orientation map of the ferrite phase. A distinct texture is visible through the centre of the section, illustrated by the dominant green colour. Coupled with this is a systematic variation in texture towards the edges of the sheet.
The texture in this sample is also represented using inverse pole figures generated from the three regions through the sample, shown in Fig. 3. A partial {110} fibre texture (fibre texture is where the crystallographic axis is parallel to one sample direction, and there is a rotational degree of freedom around this axis) is identified over the whole area. However, this is more dominant in the centre of the sample, seen both in the orientation map and the inverse pole figure, which has a MUD of 6.8.
Towards the edges (top and bottom region as marked) two different textures are present. The partial {110} fibre texture seen in the centre, and an additional partial {001} fibre texture is developed. This is identified in the inverse pole figures. The figures generated from the top and bottom region show a cluster of data on the IPF-Y figure, not seen in the middle data.
The preferred orientation seen through the sheet results from the process of rolling and annealing. The two textures present at the edges of the sheet are characteristic of the rolling process.

Fig. 2. IPF-X orientation map of ferrite, from the large area data set shown in Fig. 1, illustrating the texture distribution.
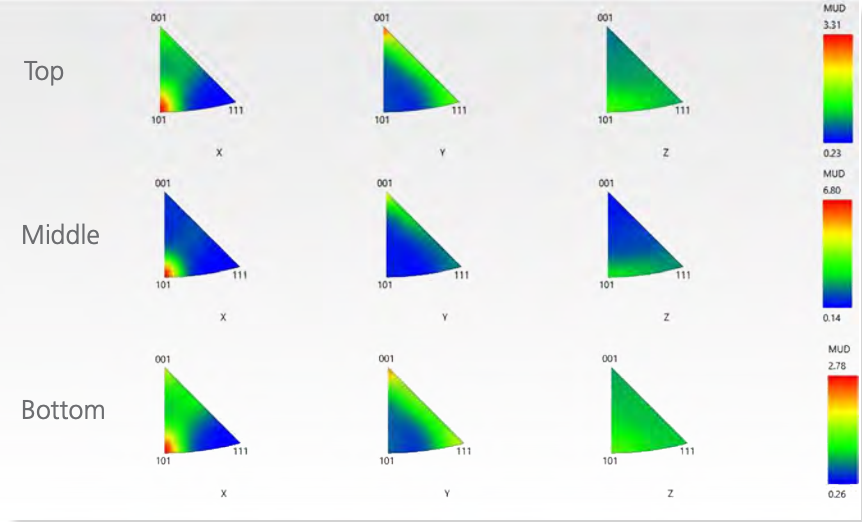
Fig. 3. Inverse pole figures of ferrite from edges and centre of the map in Fig. 2.
This texture generated during processing influences the formability of the steel. Formability is important in the application of the steel to manufacture of different components. Therefore understanding the texture assists in optimising the steel.
3. Grain Characterisation
Grain size is a fundamental microstructural parameter which will strongly affect the mechanical and physical properties of steels.
The grain structure of the austenite and ferrite are shown in Figs. 4a & 4b. The grains have been detected automatically and the grain maps reveal a bimodal grain structure: smaller austenite and larger elongate ferrite grains formed by the process of heating and rolling. The grain size was determined using a grain boundary threshold angle of 10°, with over 10,000 grains detected for each phase.
A corresponding grain statistics table and histograms of aspect ratio distribution are given in Fig. 5.
The austenite is characterised by relatively homogeneous microstructure with small, equiaxed grains, with a mean grain size (ECD) of 1.43 µm and mean aspect ratio of 1.79. The ferrite grains are larger with mean grain size (ECD) of 3.09 µm and more elongate in shape with aspect ratio up to 34.59.

Fig. 4. Grain map of austenite (a) and ferrite (b).
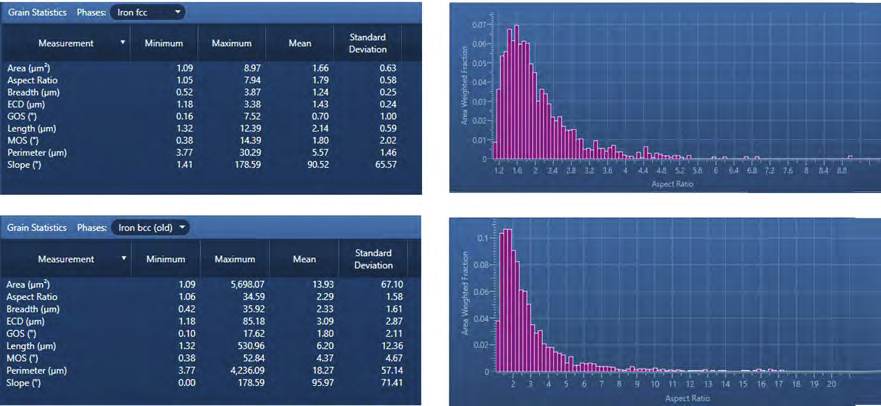
Fig. 5. Corresponding grain statistics and aspect ratio histogram of austenite (a) and ferrite (b).
As was discussed with the texture the grain structure is a direct result of the heating and rolling process. Understanding how grain size is influenced through the processing can assist to optimise steel properties for this high impact automotive application.
4. Substructure and Strain Distribution
When studying grains it is often also important to characterise substructure, as this will also influence material performance.
Substructure refers to the structure within a grain, and can be indicative of stress or strain in a material. It is typically measured as small localised changes in orientation. Here an area of the sample was examined at higher resolution, and the grain boundaries and substructure were visualised.
Fig. 6 shows substructure in the sample. Those areas with a concentration of subgrain structure (or dislocations) highlight areas of residual strain in the ferrite. These dislocations are formed during the process of recovery in the ferrite, as the material cools and the structure changes during phase transformation. Those grains without subgrain structure have recrystallised through the annealing process.
Another indication of strain distribution in the ferrite grains, shown from the same sample area, is given by Kernel Average Misorientation map (KAM) in Fig. 7. This map represents areas of misorientation within a grain, indicating strain. Higher degrees of misorientation are shown by the bright green through yellow colour on the key. The higher KAM values correspond to the regions where there is a concentration of low angle boundaries.
The development of subgrain structure and presence of strain can be utilised to further refine the grain size in material development.
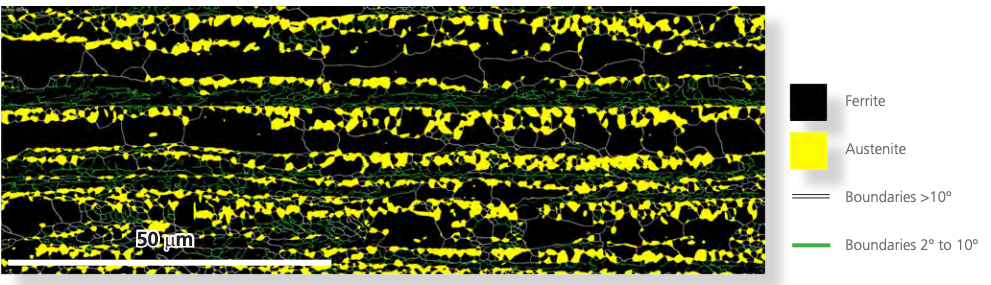
Fig. 6 Substructure was highlighted by looking at low angle boundaries through the sample. Grain boundary map of ferrite phase, illustrates the grain structure and substructure of individual grains in ferrite. Grain boundaries higher than 10º are in white and low angle subgrain boundaries between 2-10º are in green.
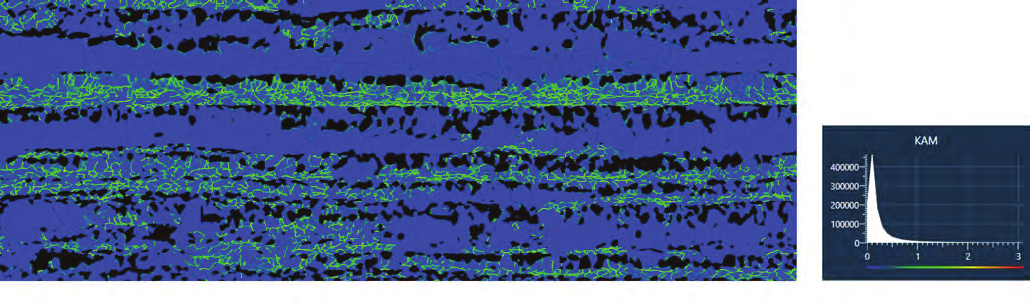
Fig. 7 Kernel Average Misorientation map (KAM) of the same area shown in Fig. 6 provides a further indication of strain distribution.
5. Precipitate Identification
Alloying through precipitation hardening plays a role in inhibiting grain boundary mobility and controlling grain size which increases the yield strength.
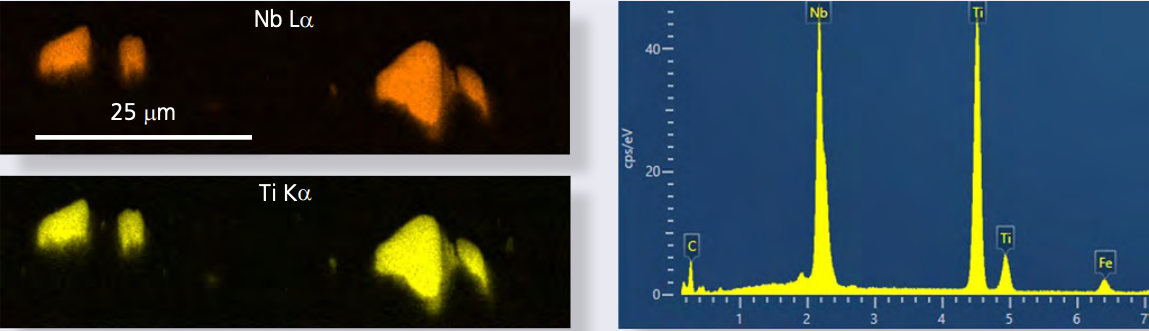
Nb & Ti were added during this process of precipitation hardening, and characterising the precipitates is essential in understanding the effectiveness of this process. Here the integration of EBSD and EDS data is used to investigate and identify the precipitates.
Fig. 8 shows an example of Nb Ti carbide in the steel. By combining the chemical signature and the crystal structure the phase can be automatically identified. In this example the precipitate was identified as (Nb Ti)C2 with an FCC structure. This phase identification aids in understanding the mechanism of precipitate formation.
Fig. 9 shows that having identified the precipitates, the area can be remapped and the phase distribution shown.
A
B
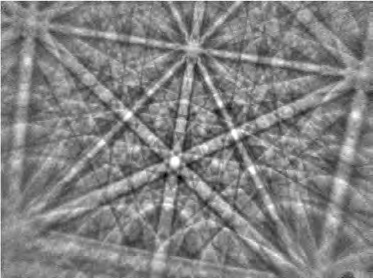
Fig. 8. Identification of Nb Ti carbides. Simultaneous EDS spectrum and EBSP were collected from the precipitates for accurate phase identification. (a) EDS element maps and spectrum from Nb Ti carbide; (b) typical EBSD pattern from a Nb Ti carbide, identified as (Nb Ti) C2 phase with cubic FCC structure.
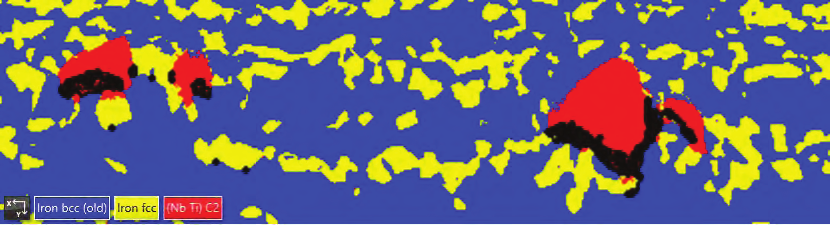
Fig. 9. Phase map with (Nb Ti) C2 phase solved.
Conclusion
EBSD and EDS are powerful techniques for characterising steel, and examining specific properties. In the example the examination of a new automotive steel is used to illustrate the wealth of information that can be obtained, and how this information is useful in understanding material mechanical properties, formability, phase transformation and precipitate hardening mechanism.
Reference
[1] R. Heimbuch, Overview: Auto/Steel partnership, www.a-sp.org

