iDus 420 CCD
View Product


Tissue biopsies are used to ensure accurate diagnosis of cancerous tissue of the lungs and the treatment planning that follows thereafter. However, a significant number of transthoracic biopsies to analyse lung lesions give indeterminate results. A group working at the Antoni van Leeuwenhoek hospital in the Netherlands are tackling this problem with the use of biophotonic techniques [1] – namely Diffuse Reflectance Spectroscopy (DRS) and Fluorescence Spectroscopy (FS) – to assess how the accuracy of the diagnostic procedure may be improved. Spliethoff et al [1,2] reporting in the journal Lung Cancer outline their design and testing of prototype instrumentation for the addition of these photonic based modalities to the standard histopathology technique, and demonstrate their benefit to the final diagnosis.
A lung needle biopsy is a procedure where the radiologist removes a small piece of lung tissue for examination using a long narrow bore extraction needle which is inserted into the chest cavity (thorax) and directed to the tissue lesion to be investigated [3]. The guidance of the needle tip to the correct site is achieved with real-time computed tomography (CT) imaging. When the biopsy is done through the wall of the chest it is called transthoracic lung biopsy or a transthoracic needle biopsy (TNB). The excised tissue is then analysed by the radiologist using the gold standard technique of histopathology, where slices of the tissue are stained with standard hematoxylin/eosin (H&E) techniques to bring out the contrast in the different components of the tissue.
The motivation of Spliethoff and his coworkers was to evaluate if optical spectroscopy incorporated at the tip of the biopsy needle can in real-time facilitate improved accuracy in the diagnosis of lung biopsies. This added modality for collection of information could help address the relatively high level (circa 23%) of reported failure rates for this type of biopsy [4].
A portable spectroscopy system was set up to carry out ex-vivo diffuse reflectance spectroscopy (DSR) and fluorescence spectroscopy (FS) on freshly excised tissue from lung lesions extracted from a range of patients diagnosed with the disease. A schematic layout of the optical system is shown in figure 1. The system contained two spectrometers (2x Shamrock SR163) and two detectors one for the visible to near-infrared (NIR) region covering 400 to 1100 nm (Andor iDus – DU420A-BRDD) and the other to cover the NIR region from 900 to 1700 nm (Andor iDus DU492A-1.7). An optical fiber probe consisting of four optical fibers was used to deliver the light to the sample from the light sources and to collect the DRS and FS signals for delivery to the spectrometers. There were two light sources used, a broadband (360–2500 nm) Tungsten halogen lamp for the DSR measurements and a diode laser (wavelength at 377 nm) for excitation of the autofluorescence species within the tissue in the FS measurements. An individual optical fiber coupled each light source to the sample, and individual fibers coupled the measurable signal to each of the spectrometers. The end of the fiber probe system for sampling the tissue was placed a short distance from the tissue to be tested – typically less than 2 mm.
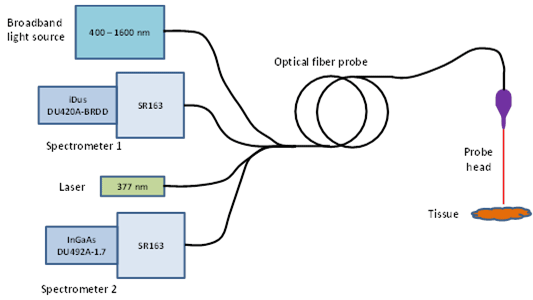
Figure 1: A schematic diagram of the main components of the optical system.
For integration, control of the system and acquisition of data, a custom-made Labview program was developed (National Instruments). Measurements were made at multiple points within each sample. With the two spectrometer - two detector combination it was possible to capture DRS spectral data over the whole range from 400 nm to 1600 nm. The FS data was captured in the 400 to 800 nm region with the deep-depletion back-illuminated (DU420A-BRDD) detector only. After the optical measurements were complete the samples were put through the histopathology process and classified by the pathologist without any knowledge of the results from the optical data.
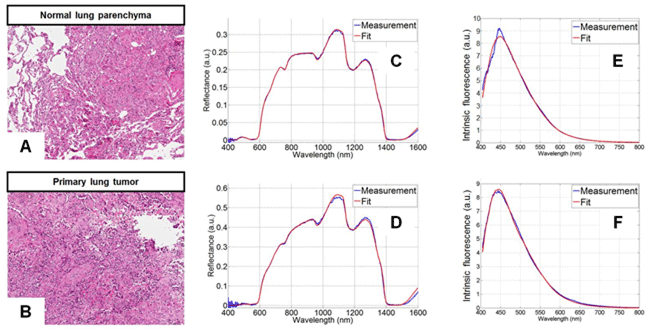
Figure 2: Typical DRS and FS spectra including fitted spectra from the models for both healthy and cancerous tissue. On the left are shown typical images of stained tissue samples used in histopathology. Figure reproduced with permission from journal Lung Cancer, 80 (2013).
Typical DRS spectra from healthy and cancerous tissue are shown in figures 2(C) and 2(D) respectively. The main spectral features of interest are influenced by the absorption in the visible range (400–800 nm) associated with the chromophores of oxygenated and deoxygenated haemoglobin of normal tissue, and the main absorbers in the NIR range (900-1600 nm) of water, collagen and fat. When diffuse scattering is considered it is dominated by Mie and Rayleigh (elastic) scatter. Mie scattering occurs when light interacts with particles of a size comparable to the wavelength of the light, whilst Rayleigh scatter occurs when the light interacts with particles much smaller than the wavelength of incident light. The main characterising parameters derived from the scatter were,
The total scatter was considered to principally consist of both Mie and Rayleigh scattered light.
Taking into account parameters such as the absorption coefficient, the reduced scattering coefficient and the distances from the exit facets of the probe fibers and the sample tissue, a proven DRS analytical model [5] was used to fit spectra to the measured DRS spectra. Fits to the typical DRS spectra are included in figures 2(C) and 2(D).
Similarly an FS analytical model was constructed for analysis of the captured fluorescence spectra. The FS spectra were first corrected for scattering and absorption. Using the intrinsic fluorescence spectra (with excitation of 377 nm) for collagen, elastin, FAD and NADH, the corrected spectra were fitted by the deduced spectra from the model. Typical FS spectra for healthy and tumorous tissue are shown in figures 2(E) and 2(F) respectively and corresponding fits derived from the FS analytical model are also included. The FS results proved particularly useful in distinguishing between necrotic and non-necrotic tissue. Necrotic tissue consists of dead or dying cells in a localised region brought about by factors external to the cells, such as infection, toxins, or trauma.
A measure of the cellular metabolic state can be provided by what is called the optical reduction-oxidation (redox) ratio. Spliethoff et. al. defined this as the ratio of NADH to NADH+FAD. NADH stands for hydrogenated nicotinamide adenine dinucleotide and is a macromolecule found in all living cells; chemically it can act as a reducing agent. FAD stands for flavin adenine dinucleotide and likewise is a macromolecule found in all living cells. Both these chemicals perform vital roles in the underlying metabolic processes of the cell.
Using a classification and regression trees (CART) algorithm with the derived parameters (tissue composition, physiological characteristics and metabolic activity) from the spectral data, Spliethoff et.al. were able to classify the different tissue types. Comparing with the gold standard of histopathology allowed a specificity and sensitivity to be determined for the classification achieved using their optical technique.
Discrimination between lung parenchyma and tumor tissue using all the DRS data achieved a sensitivity of 98% and a specificity of 86%. Using the FS parameters they achieved discrimination between necrotic and non-necrotic tissue with 91% sensitivity and 91% specificity.
The group’s work clearly demonstrated that DRS spectroscopy can offer accurate real-time diagnosis of malignant lung tissue, and it further showed how FS spectroscopy can be used to identify necrotic tissue. This highlights the potential that optical techniques may offer in the future for enhancement of the diagnostic quality of various biopsy procedures.
Acknowledgement: Figure 2 is reproduced with permission from the journal Lung Cancer, 80, (2013).
References:
© Oxford Instruments 2026