Summary
- Increase the speed and accuracy of Fat, Oil and Grease (FOG) analysis in wastewater
- Easiest, most reliable technique available; suitable for non-specialised personnel
- Minimal sample preparation
- Increase throughput with automated analysis
- Non-destructive technique, allowing solvent extraction verification after analysis
Application
Fat, Oil and Grease (FOG) is often described as a pollutant since it is discharged in wastewater causing build-up and
subsequent blockage of sewers. Therefore, it is a crucial parameter in environmental monitoring performed by water
suppliers' laboratories and environmental authorities.
In the United States, "oil and grease" is classed as a conventional pollutant under the US Clean Water Act.
The US Environmental Protection Agency method 1664 (solvent extraction followed by gravimetry) is used for survey and
monitoring programs related to this and other legislation.
In the United Kingdom, the most commonly used method separates FOG from the water by passing it through a glass fibre
filter (1.2 μm pore size). The FOG is extracted from the filter using petroleum ether (leaving the solid particulates
behind) with the total amount determined by gravimetry after the solvent has been boiled off.
In contrast to the labour-intensive and destructive solvent extraction method, this application note describes a
fast, accurate and solvent-free variant of the method whereby the FOG is directly measured on the filter without
extraction.
Advantages of NMR
Solvent extraction is commonly used for the measurement of FOG deposited on a filter. However, this method can be
time consuming, requires skilled operators and the use of hazardous solvents.
In contrast:
- NMR does not require hazardous solvents which are costly to dispose of
- NMR is a bulk measurement technique which selectively measures all of the oil and fat in the sample regardless of
the distribution of the grease on the filter
- A linear calibration is readily generated using a few gravimetrically prepared samples
- NMR enables rapid measurement of oils and fats with different fatty acid compositions
The MQC+ benchtop NMR analyser provides an alternative to extensive wet-chemistry methods. FOG
analysis with the MQC+ is quick and easy to perform, simple to calibrate and requires minimal sample
preparation. As such it is ideal for non-specialist laboratory personnel and the whole process can be automated using
the MQ-Auto autosampler.
Method
Benchtop NMR detects the signal from oil and fat on a single filter sheet after the initial NMR signals from the
solids and any residual moisture have decayed completely. The remaining signal intensity correlates with the mass of
FOG on the sample.
Calibration
Since NMR calibrations are always linear, only two well characterised standards are required to calibrate the
analyser. However, it is recommended that the instrument is calibrated using at least 6 standard samples with known
FOG contents, evenly distributed over the range of interest. The samples must be dry prior to the NMR measurement.
In this study, the calibration standards were prepared by adding 100 mg of the desired composition of fat, oil or
grease (edible oil, animal fat, mineral oil, engine lubricant, etc.) to petroleum ether (100 ml), followed by adding
aliquots of this mixture to clean filter sheets. After drying, the reference grease content of each standard was
measured using a precision analytical balance to at least four decimal places (± 0.1 mg).
Measurements
To prepare a sample for analysis, a dried filter sheet containing filtration residuals was folded and placed into a
small glass vial. The samples were then temperature conditioned at 40°C in a dry block for a minimum of 20 minutes
prior to measurement by the MQC+. The total measurement time for one sample was 5 minutes, excluding sample
conditioning time.
Results
Comparison of NMR and Solvent Extraction Using Artificial Standards
Figure 1 shows a calibration obtained by measuring a set of calibration standards created by adding known amounts of
a FOG mixture to various filter papers.
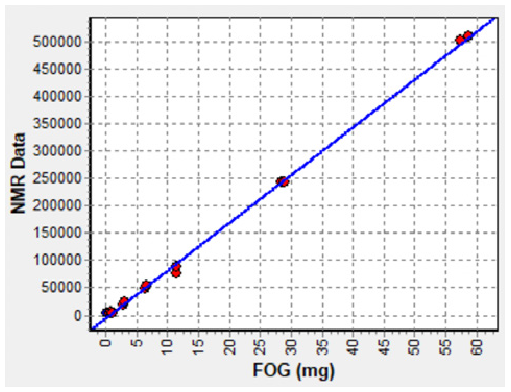
Fig. 1 — NMR calibration generated for the set of standards prepared using gravimetric data for the oil/fat
mixtures. The correlation coefficient and standard deviation are 1.00 and 0.70 mg respectively.
A comparison of FOG content measurements performed on the calibration standards against gravimetry is shown in Table
1; it clearly shows that the NMR method is more accurate than solvent extraction (using petroleum ether).
Table 1. Comparison of solvent extraction and NMR results for FOG content against gravimetry
| Sample ID |
Reference FOG content measured gravimetrically m0, mg |
FOG content determined by extraction method m1, mg |
FOG content measured by NMR method m2, mg |
Difference |m0-m1|, mg |
Difference |m0-m2|, mg |
| 1 |
0.6 |
0.3 |
0.9 |
0.3 |
0.3 |
| 2 |
0.8 |
0.6 |
0.9 |
0.2 |
0.1 |
| 3 |
0.8 |
3.4 |
1.0 |
2.6 |
0.2 |
| 4 |
4.5 |
5.3 |
3.7 |
0.8 |
0.8 |
| 5 |
10.0 |
8.4 |
8.9 |
1.6 |
1.1 |
| 6 |
21.3 |
20.1 |
21.2 |
1.2 |
0.1 |
| 7 |
59.4 |
54.8 |
56.9 |
4.6 |
2.5 |
| 8 |
98.4 |
94.5 |
97.7 |
3.9 |
0.7 |
| 9 |
205.0 |
193.3 |
205.4 |
11.7 |
0.4 |
Comparison of NMR and Solvent Extraction Using Wastewater Samples
In addition, a set of real samples prepared by passing wastewater through filters were measured non-destructively by
NMR (using the calibration produced from artificial standards in Figure 1) followed by the extraction method; the
results are shown in Figure 2. The two methods show a very good correlation, with the exception of sample 17 from
which glycerol was also extracted (derived from soap-based products) and sample 20 which was an inhomogeneous sample.
The data also shows that the limit of detection of the NMR method is 1 mg/L (compared to 8 mg/L for the solvent
extraction method).
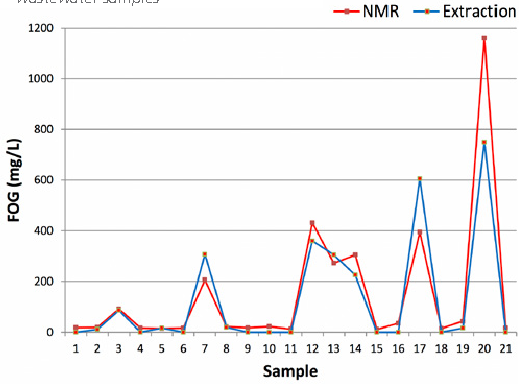
Fig. 2 — NMR and solvent extraction results for wastewater samples.
Comparison of NMR and Solvent Extraction Repeatability Using Wastewater Samples
A set of twelve filter papers were prepared using the same sample of wastewater. Again, these were analysed by NMR
first followed by solvent extraction; the results are shown in Table 2.
Table 2. Results of NMR repeatability test from the same sample of wastewater
| Method |
Repeat Measurements: FOG content, mg |
Mean, mg |
Standard deviation, mg |
| NMR |
19.7 |
20.8 |
20.9 |
19.4 |
20.0 |
18.9 |
19.4 |
18.2 |
18.4 |
19.1 |
18.6 |
18.3 |
19.3 |
0.9 |
| Soxhlet |
18.6 |
19.3 |
19.7 |
17.5 |
18.1 |
17.8 |
17.7 |
16.8 |
17.2 |
17.1 |
17.3 |
17.2 |
17.9 |
0.9 |
The t and f tests applied to this data (95% confidence interval) show there is a significant difference between the
means of the two methods but not the standard deviations; the NMR results are slightly higher than those for solvent
extraction which tends to have a low recovery. Furthermore, it is noticeable that the results by the two methods
correlate with each other for this composite sample.
Conclusions
- The sensitivity of the MQC+ analyser enables accurate measurement of FOG on a single filter
sheet; the limit of detection of the filtration followed by NMR method is 1 mg/L.
- NMR measurement precision is comparable to the solvent extraction method, but potentially more consistent as it is
less prone to operator error.
- Minimal sample preparation is required, removing the need to use hazardous solvents and other media.
- The single sample measurement is rapid (typically 5 minutes) compared to solvent extraction which can take a few
hours.
- Samples can be measured automatically in batches with the MQ-Auto during the day and night.
- The NMR technique is non-destructive enabling convenient repeat measurements.

