1. Introduction
Interest in Raman spectroscopy at room temperature, as well as at cryogenic temperatures, has been increasing across a range of scientific fields over the past two decades. Initially, the primary driver of cryogenic applications was the carbon nanotubes and graphene community. As a response to the needs of these researchers, attocube systems and WITec — world leaders in their respective specialties of cryogenic scanning probe microscopy and Raman spectroscopic imaging — teamed up in 2010 to develop attoRAMAN, the world's first commercial cryogenic Raman microscope.
In the meantime, cryogenic Raman spectroscopy in high magnetic fields has become an indispensable tool for studying various novel materials, in particular for researchers focused on phase-transitions or emergent properties of low-dimensional materials with application potential in electronics or sensorics. A recent surge in the number of published cryogenic Raman studies is dominated by research on transition metal dichalcogenides and van der Waals heterostructures. In order to meet evolving market requirements, the two southern German companies combined their expertise once again to create cryoRaman — the cutting-edge solution for cryogenic Raman spectroscopy.
Building on the established success of previous WITec and attocube co-development projects and furthering the integration of the constituent technologies enables cryoRaman to deliver improved accessibility and configurability. Several new functionalities, such as low-wavenumber Raman peak detection, polarization control and the full automation of measurements, render cryoRaman tunable to specific needs of different research fields. Moreover, as the combination of superior optics and the lowest-vibration cryostats, cryoRaman offers the highest data acquisition speed with unequalled lateral, depth and spectral resolution.
2. Description of the cryoRaman Instrument
The fundamental advance with respect to existing products is that cryoRaman can be equipped with the full catalog of WITec optical components as known from their alpha300 confocal microscope series. This not only delivers a significant leap in spatial resolution (<400nm laterally, <2µm in depth), it also means that cryogenic confocal Raman microscopy can now be augmented with a wide range of upgrades and capabilities that the community has been requesting. For instance, with the RayShield coupler, wavenumbers down to 10 rel. 1/cm and anti-Stokes signals are now easily detectable and this approach can be combined with the polarization upgrade, which is particularly interesting for the field of valleytronics. Other modules that enhance the system's flexibility and convenience have also found their way into the list of available components: automated alignment and calibration, TruePower (automated laser output adjustment) and motorized switching between different excitation lasers and white light microscopy. With these functionalities cryoRaman has achieved a level of user-friendliness that makes high resolution confocal Raman imaging at cryogenic temperatures in high magnetic fields accessible to researchers of all experience levels.
The unique advantages of cryoRaman stem from the seamless integration of WITec's high-throughput optics and leading-edge Raman technology with the exceptional performance and efficiency of attocube's closed-cycle cryostats. The attoDRY2100 series is a high-end cryogenic system compatible with cryoRaman that allows for measurements at variable temperatures from <1.8K up to 300K. With a wide range of solenoid and vector magnet options, it is particularly well suited for spin-resolved spectroscopy and can be complemented by in situ magneto-transport measurements with the addition of coaxial lines. If only the base temperature is of interest, the attoDRY1000 offers an affordable alternative. Much research in the field of quantum optics and (time-resolved) valleytronics requires complex optical setups. These can generally be realized with WITec optical components, but for additional flexibility, the integration of cryoRaman with the attoDRY800 cryostat is currently under development.
The outstanding performance of cryoRaman is only achievable by preserving the full capabilities of both companies' technology in combination. It is often difficult to achieve high confocality within a cryogenic system because the bore size of the magnet leaves little space and optical access is hindered. A proven solution to this problem is found in attocube's low-temperature objectives. The LT-APO objectives are designed for, and tested at, low temperatures and high magnetic fields. Unique in the marketplace, they offer outstanding optical performance, numerical apertures of 0.81–0.82, and their apochromatic ranges match all typical Raman laser wavelengths (532nm, 633nm, 785nm) while enabling a lateral resolution of <400nm in confocal scanning.
High resolution Raman map creation is facilitated by a direct electronic interface between WITec's scan controller and attocube's cryogenic piezo scanners. This makes it possible to program all typical Raman and photoluminescence measurements within WITec's Suite FIVE control software. With attocube's patented slip-stick drive piezo steppers, the sample can be brought into focus and the sample's region of interest can be accessed.
In its base configuration, cryoRaman features a 532nm excitation laser and a RayLine coupler, which gives access to wavenumbers of >80 rel. 1/cm. The attoDRY2100 with a 9T solenoid magnet is the typically specified cryostat. The following sections provide more details on available upgrade options.
2.1 Volume Bragg Gratings
In addition to Raman spectroscopy using conventional edge filters (RayLine design), which allows for the detection of Stokes scattering from typically ~+80 rel. 1/cm onwards, the use of volume Bragg gratings has become ever more popular in recent years. Using these optical elements, the detection of Stokes as well as anti-Stokes Raman scattering is possible with the additional benefit of detectability down to typically ±10 rel. 1/cm. In the WITec setup these elements are integrated within the RayShield coupler and are available for most common wavelengths.
2.2 Polarization Analysis
Irrespective of whether a RayShield or RayLine coupler is used, the excitation laser light always enters the microscope with a highly linear polarization. Using the polarizer upgrade, the direction of the linear polarization can be rotated, or it can be converted into circular polarization. In addition, an analyzer can be introduced into the detection beam path to allow only certain polarization directions to pass through to the spectrometer. Both the polarizer and the analyzer can be rotated independently and freely in order to match, for example, the crystalline axis of a sample. Both polarizer and analyzer modules are available in a manual as well as a motorized configuration. The latter version allows the acquisition of:
- Polarization series (rotation of the incoming polarization while the analyzer remains fixed and automated recording of spectra at selectable angles)
- Analyzer series (rotation of the analyzer while the incoming polarization remains fixed and automated recording of spectra at selectable angles)
- Combined series (rotation of the polarization direction and of the analyzer with a fixed relative angle and automated recording of spectra at selectable angles)
2.3 Motorization and Automation Possibilities
Apart from the above-mentioned motorization of the polarizer and analyzer, most other components used in the cryoRaman setup can also be motorized. For WITec's alpha300 and RISE platforms, which use parts largely identical to those in cryoRaman, the most popular motorized feature is automatic switching between white light microscopy and Raman microscopy. This module greatly accelerates the experimental workflow and eliminates the need to touch the system at all during the most frequently performed operation on any confocal Raman microscope. Switching between various excitation wavelengths can also be automated and the recently introduced AutoBeam technology automatically optimizes the pinhole position for each excitation laser independently of the sample. The AutoBeam coupler also automatically switches between different spectrometers in, for example, systems optimized for both VIS and NIR wavelengths. Another aid to efficient operation is a fully automated calibration coupler. In combination with WITec's software-driven multi-point spectrometer calibration over the full spectral range, it ensures a high level of confidence in the data recorded.
2.4 TruePower Laser Control
In addition to automation of the microscope components themselves, the TruePower laser power control module enables the precise setting and documentation of the laser power used with an accuracy down to <0.1mW (<1µW upon request). With this option the laser always operates at the same output power, which enhances its stability and lifetime, and the light intensity transmitted to the microscope can be attenuated through software. In addition to the precise setting of the power and its automatic recording with each measurement, TruePower allows the acquisition of power series. In this measurement mode, the laser power is varied and at each power level a spectrum is recorded. Through the corresponding variation of the integration time, the spectra show approximately the same intensity, but laser power-induced peak shifts or sample modifications can easily be evaluated. The researcher can then set the optimal laser power for each sample. TruePower also includes an automatic shutter that always blocks the laser whenever a measurement isn't being performed. This avoids unnecessary exposure of the sample to laser radiation and enhances the overall safety of the system.
2.5 Raman Excitation and Detection Options
The cryoRaman system can be equipped with various excitation wavelengths throughout the VIS to NIR spectral range. For optimized detection the WITec UHTS spectrometer series consists of several models. This allows the use of optimized optics, gratings and CCD cameras for the corresponding detection range, without the need to manually exchange gratings or manually re-align any elements within the spectrometer.
The optimal cryoRaman set up in terms of excitation wavelength or spectrometer variant largely depends on individual experimental requirements and many configurations are available upon request.
3. High Resolution, Low Temperature Confocal Raman Imaging on WSe2
As a first demonstration of cryoRaman's confocal Raman imaging capabilities, a WSe2 flake on Si/SiO2 was recorded at 120K. The image is 30x30µm² in size with 400x400 pixels (spectra) resolution and an integration time of 150ms per spectrum. A 532nm laser was used for excitation and the RayShield coupler allowed detection of Raman bands down to ~±10 rel. 1/cm. A UHTS300 spectrometer optimized for detection in the visible range with an 1800g/mm grating and a back-illuminated CCD camera was used.
Inside the cryostat an attocube LT-APO 532-RAMAN objective with a numerical aperture of 0.82 and attocube piezoelectric positioners controlled through WITec's Control FIVE software were used. The acquired data set was evaluated with the WITec Project Plus software package using the cosmic ray removal tool as well as background subtraction before TrueComponent Analysis was employed to automatically identify the sample components (Figure 1[b]) by layer number. The images showing the tungsten diselenide in different numbers of layers were then combined in the false color image shown in figure 1[a]. Figure 1[c] shows a zoom-in of the low-wavenumber area with the most prominent peaks for the double and triple layers as labelled, which is in good agreement with the literature.
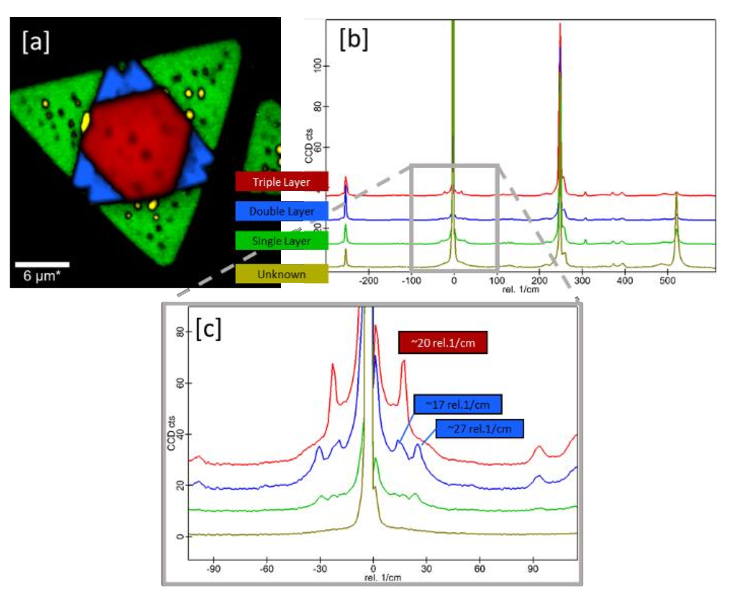
Fig. 1 — Confocal Raman image of WSe2 of various layer numbers at 120K. [a] Combined false-color image showing the location of the different numbers of layers. [b] Raman spectra of the layers in the corresponding colors and [c] zoom-in of the spectra around the Rayleigh peak.
The presence of the single, double and triple layers could be clearly identified by the peaks present. The unknown phase shows in part the features of the single layer, but with an enhanced intensity of the Si-peak near 520 rel. 1/cm.
4. Spatial Resolution of cryoRaman
In order to determine the resolving power of the system at low temperatures, a sample with oriented carbon nanotubes (CNTs) on Si was investigated in a confocal Raman imaging scan at 2K. Here an area of 29x29µm² with 290x290 points was scanned using a RayLine Raman coupler (only allowing Stokes detection) with the remaining parameters as described above. Figure 2[a] is the image of the integrated intensity of the CNT G-band while Figure 2[d] shows a typical CNT Raman spectrum. In Figure 2[b, c] two extracted cross sections depict the determined full width half maxima (FWHM) of the CNTs.
As the ring-breathing modes (RBMs) are detectable, it can be concluded that the measured CNTs were single-walled. They were therefore much smaller in diameter than the limit of resolution of the instrument. Mathematically speaking, they represent a delta-function for the convolution of sample features with the instrument function. Thus, the measured FWHM can be taken as a measure for the achievable lateral resolution with this system.
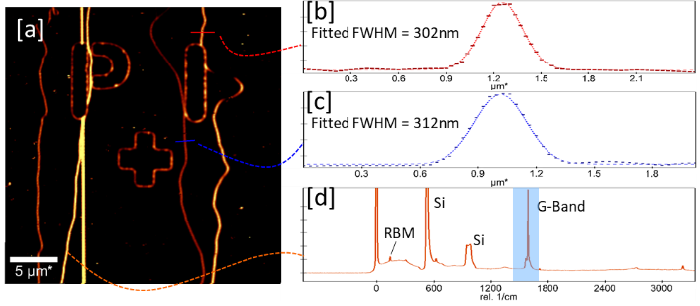
Fig. 2 — Confocal Raman imaging scan of CNTs at 2K. [a] Integrated intensity of the CNT G-Band. [b, c] Cross section of the intensity profile of the recorded CNTs. [d] Typical spectrum of one of the CNTs showing the spectral features of the CNT and the underlying substrate.
The depth resolution of the system was determined with a plain piece of silicon as being ~1.7µm in the above-mentioned configuration. It has been shown in literature that the determination of depth resolution using Si produces results similar to those on suspended graphene at 532nm excitation, which would again represent a delta function for the convolution.
5. Temperature-dependent PL Measurements on WSe2
In order to demonstrate temperature-dependent photoluminescence (PL) measurements, part of the same WSe2 flake as shown above was measured at varying temperatures. For this experiment, the photoluminescence signal was recorded instead of the Raman signal. The same hardware as described above was used, but the 600g/mm grating was rotated under software control to a slightly different angle for this purpose. Figure 3[a-d] shows the position of the PL peak of the WSe2 recorded at different temperatures, while Figure 3[e] shows example spectra recorded from the flake and the edge of the flake for each temperature. The two- and three-layer areas of the flake did not emit significant signals, as was expected. It can be seen that the PL peak near the edge is shifted to lower wavelengths (higher energies) at all temperatures. Such a shift in the photoluminescence peaks of WSe2 flakes has already been reported for room temperature experiments. Figure 3[e] additionally illustrates the peak shift as well as the peak sharpening with decreasing temperature.
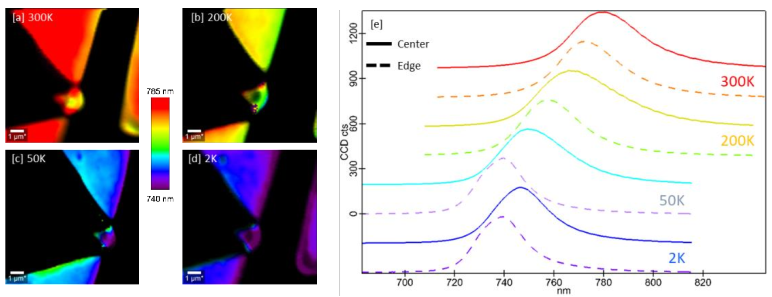
Fig. 3 — Confocal photoluminescence imaging scans of WSe2 at varying temperatures. [a-d] Peak position images at varied temperatures. [e] Normalized spectra at each recorded temperature with the solid lines representing the spectra in the center of the single layers and the dashed lines the spectra at the outer edge of the single layers, respectively.
6. Polarization Analysis of WSe2
The same sample position as used for the PL measurement above was also scanned at 2K through varying polarizer and analyzer orientations. The Raman peak near 250 rel. 1/cm (see Figure 1[b]) was first iteratively optimized by rotating the polarizer and analyzer to determine the parallel polarization with respect to the crystalline orientation. A Raman image was then recorded in this configuration before the analyzer was rotated by 90° (optimal perpendicular configuration) and the scan was repeated. From the resulting data sets, the average spectra for the corresponding layers were extracted as shown in Figure 4.
The spectra were normalized to the peak near 395 rel. 1/cm in order to facilitate the comparison. It can be seen that the Si peak near 520 rel. 1/cm is almost completely suppressed. For both the double and the triple layers, the peak near 305 rel. 1/cm is also largely suppressed in the perpendicular configuration. The fact that it was not completely suppressed may be due to the averaging process, by which imperfect locations on the layers were also taken into account. For the double layer, it can additionally be seen that the peak near 27 rel. 1/cm is largely suppressed in the perpendicular configuration, whereas the peak near 17 rel. 1/cm appears stronger in comparison.
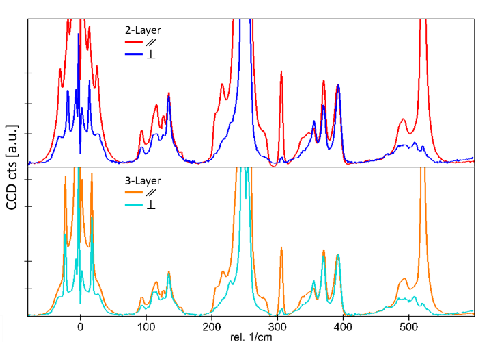
Fig. 4 — Polarization-dependent spectra of double and triple layer WSe
2
at 2K. All spectra are normalized to the peak near 395 rel. 1/cm.
7. Magnetic Field- and Polarization-dependent Measurements on MoS2
In order to demonstrate the dependence of Raman signals on polarization in varying magnetic fields, experiments were performed following the examples shown by Yang et al. and Ji et al. For this a MoS2 flake on Si was imaged at <2K while both the magnetic field as well as the polarization was varied. The location chosen on the sample contained a flake consisting of different numbers of layers. The optimal parallel configuration for the polarizer and analyzer was determined by iteratively rotating the polarizer and analyzer until the A'1 Raman signal of a single layer of MoS2 was maximized. For the measurement in the perpendicular configuration the analyzer was then rotated by 90°. Figure 5 shows two example spectra recorded in this configuration while a magnetic field of 9T was applied perpendicularly to the sample surface.
The suppression of the A'1 Raman signal of MoS2 can clearly be seen in the perpendicular configuration. In addition, the 1st order Si peak was reduced in intensity, but is still significantly stronger than the MoS2 peaks. This is in contrast to the spectra shown in Figure 4 and can be attributed to the fact that the orientation of the MoS2 flake relative to the Si crystalline axis was different than the orientation of the WSe2 flake on its substrate. The 2nd order Si peak, however, was largely suppressed in the perpendicular configuration for the given orientation (see Figure 5).
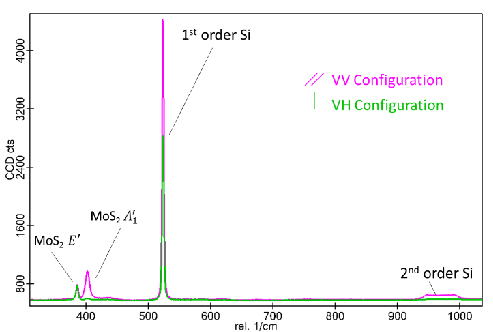
Fig. 5 — Polarization-dependent spectra of single-layer MoS2 recorded at 9T and 2K.
The flake was imaged using 532nm excitation (8mW before the objective) through a RayLine filter set and a UHTS300 spectrometer with a 1800g/mm grating and a back-illuminated CCD camera. The objective was again a LT-APO 532-RAMAN objective with a numerical aperture of 0.82. Images were recorded with an image size of 28x22µm² with 112x88 points per image and an integration time of 0.15s per spectrum. Images using identical parameters were recorded in varying magnetic fields and in parallel and perpendicular polarization configurations, respectively. The integrated intensity of the A'1 Raman signal of MoS2 was normalized against the integrated intensity of the E' peak for each measurement and all images in Figure 6 are coded using the same color scale. Pixels at which no E' peak was present were suppressed in the visualization below to enhance clarity and the lower limit of the color scale was intentionally set to -0.1 in order to visualize the flake even in configurations where no A'1 Raman signal was detectable (dark gray areas).
The change in suppression of the A'1 Raman signal from perpendicular to parallel polarization configurations as the magnetic field is increased from 0 to 5T, and back again when approaching 9T, is in good agreement with Yang et al. However, this change could only be detected at significantly higher magnetic fields in that study. Yang et al. propose the low temperature used in their experiments as a potential explanation, which was also the case in our experiments.
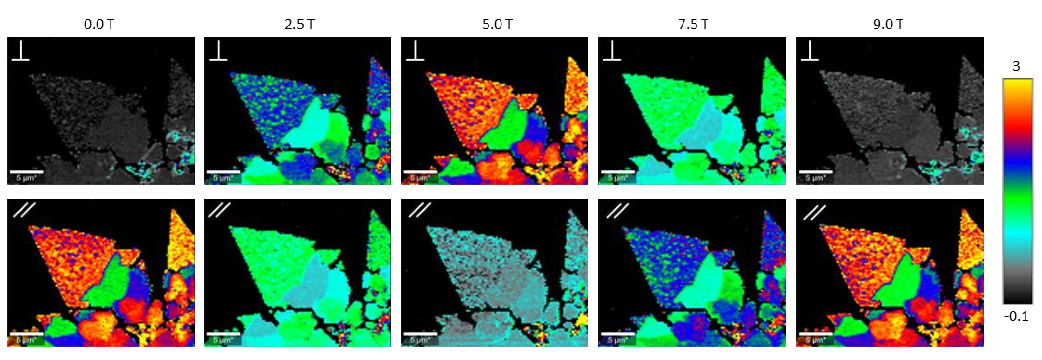
Fig. 6 — A'1/E' intensity ratio recorded at 2K for different magnetic field strengths and polarization states.
While influence of the perpendicular magnetic field on the oscillation modes of the crystal seems plausible, it is important to consider the impact of the Faraday effect. The Faraday effect causes a rotation of the polarization axis when light travels through transparent media in the presence of a magnetic field. In practical terms this means that the polarization axis of the light is rotated after passing through the LT-APO objective by an angle that correlates linearly with the magnetic field strength. To further illustrate this, the relative suppression of the A'1 mode in MoS2 is compared to the relative suppression of the 2nd order Si peak.
For this purpose, a series of spectra was recorded on a single-layer MoS2 flake in varying magnetic fields and in parallel and perpendicular configurations. The integrated intensity of the MoS2 A'1 Raman signal was again normalized against the integrated intensity of the E' peak. In addition, the 2nd order Si peak was normalized against the 1st order Si peak. Figure 7 shows the resulting data as a function of the magnetic field strength in parallel and perpendicular configurations. The data for each respective data set was normalized from minimum to maximum.
The MoS2 and Si peak ratios show approximately the same dependence on the magnetic field. This indicates that the dominant cause for the changes in the detected Raman signals is the rotation of the polarization axis induced by the Faraday effect. Previous tests at attocube have demonstrated that the rotation angle is predictive and highly linear with respect to the magnetic field strength. It is therefore straightforward to compensate for this rotation by adjusting the incoming polarization axis accordingly. In combination with WITec's motorized optical components, this compensation could even be automated e.g. via LabVIEW-driven control of both instruments.
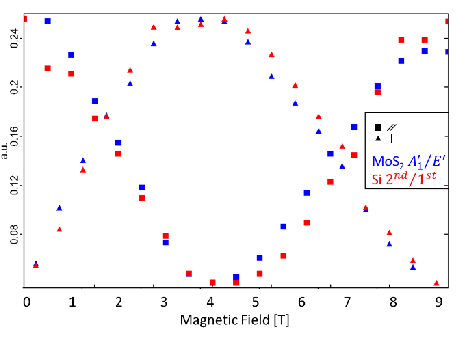
Fig. 7 — A'1/E' of MoS2 ratio and Si 2nd/1st order peak ratio recorded at 2K for different magnetic field strengths and polarization states.
8. Conclusion
As demonstrated conclusively in the measurements above, cryoRaman offers a tremendously wide range of experimental possibilities while maintaining a user-friendly mode of operation. In the attoDRY2100 cryostat the sample base temperature is <1.8K and is variable up to 300K. Within this range of temperatures, Raman and photoluminescence peaks can be observed, and their temperature-dependent shifts and changes are of great interest in the study of phase transitions. High resolution Raman maps with a lateral resolution of <400nm not only allow for material characterization, but also for selectively identifying regions of interest. Raman peaks down to 10 rel. 1/cm are conveniently detected and polarization control offers many possibilities in the field of spin-valley physics. This is complemented with unidirectional and vector magnet options. A wide variety of combined in situ measurements becomes possible by the introduction of coaxial and optical fiber feedthrough lines.
In addition to the examples shown in this whitepaper, the extensive catalog of confocal measurement techniques available with the WITec alpha300 series can also be implemented in the cryoRaman platform, such as time correlated single photon counting (TCSPC) techniques (e.g. FLIM) or antibunching measurements.
WITec and attocube hope that cryoRaman will be instrumental in many important scientific discoveries to come. We have designed it to serve that purpose. It offers the highest spatial resolution on the market (400nm), sharpest depth resolution (2µm), lowest cut-off (10 rel. 1/cm), cryogenic objectives with highest NA (0.82), lowest z-vibrations (1nm peak to peak), most accurate power control (0.1 mW), highest spectral resolution (<0.8 rel. 1/cm), lowest temperature (1.8K), highest magnetic field (12T and vector fields), and highest data acquisition speed enabled by the highest sensitivity (<1ms per spectrum). Moreover, cryoRaman — in its modularity — offers upgrade and motorization possibilities that provide for a unique user-friendly experience that meets the individual requirements of specific applications.

