Confocal Raman Imaging
Raman spectroscopy has long been applied in geoscience, for example for the identification and characterization of minerals, or in the observation of mineral phase transitions in high and ultra-high pressure/temperature experiments. In most cases, measurements have been carried out with a micro-Raman setup, i.e. information was obtained from single or multiple points of interest on a sample. This approach yields only limited information about the spatial distribution of components, mineral phases and chemical variations. However, a more detailed representation of the sample's chemical composition is valuable for many geological studies, particularly for complex samples.
By means of confocal Raman imaging, the spatial distribution of chemical characteristics can be evaluated on different length scales – from large-area scans on the centimeter scale to detailed investigations with sub-micron resolution. WITec confocal Raman microscopes of the alpha300 series allow for such measurements with very high sensitivity and resolution. Raman imaging is a tool that provides information complementary to data obtained by e.g. electron microprobe (EMP), energy dispersive X-ray analysis (EDX) or secondary ion mass spectrometry (SIMS). These techniques acquire quantitative, semi-quantitative elemental and isotopic data. In addition, confocal Raman imaging contributes the distribution of chemical components over a defined sample area. Furthermore, considering that most geo-materials are to some degree transparent for near-ultraviolet (NUV), visible and near-infrared (NIR) light, this information can be obtained three dimensionally due to the confocal setup of the microscopes. The following examples highlight some key analytical features of this technique for geoscience applications.
The Raman Principle
The Raman effect is based on the inelastic scattering of light by the molecules of gaseous, liquid or solid materials. The interaction of a molecule with photons causes vibrations of its chemical bonds, leading to specific energy shifts in the scattered light. Thus, any given chemical compound produces a particular Raman spectrum when excited and can be easily identified by this individual "fingerprint."
Raman spectroscopy is a well-established, label-free and non-destructive method for analyzing the molecular composition of a sample.
Raman Imaging
In Raman imaging, a confocal microscope is combined with a spectrometer and a Raman spectrum is recorded at every image pixel. The resulting Raman image visualizes the distribution of the sample's compounds. Due to the high confocality of WITec Raman systems, volume scans and 3D images can also be generated.
No Need for Compromises
The Raman effect is extremely weak, so every Raman photon is important for imaging. Therefore WITec Raman imaging systems combine an exceptionally sensitive confocal microscope with an ultra-high throughput spectrometer (UHTS). Precise adjustment of all optical and mechanical elements guarantees the highest resolution, outstanding speed and extraordinary sensitivity – simultaneously!
This optimization allows the detection of Raman signals of even weak Raman scatterers and extremely low material concentrations or volumes with the lowest excitation energy levels. This is an unrivaled advantage of WITec systems.
Sensitivity
A high confocality increases the signal-to-noise ratio by reducing the background. With the UHTS Series, WITec developed lens-based, wavelength-optimized spectrometers with a spectral resolution down to 0.1 cm-1 relative wavenumbers.
Resolution
Lateral resolution is physically limited to ~200 nm, depending on the wavelength of the incident light.
Speed
The more sensitive a system is, the shorter the acquisition time for a single spectrum. WITec's Ultrafast Raman Imaging reduces acquisition times for single Raman spectra down to well below 1 ms.
Large Area Raman Analysis: Overview and Details
A sample from the deep biosphere of Äspö, Sweden, was studied using the large-area scan mode of a confocal Raman microscope (Oxford Instruments WITec), aiming to characterize secondary cleavage fillings in a 1.8 to 1.4 billion-years-old diorite.
A section (Fig. 1A) was obtained from a drill core from borehole KJ 0052 F01, run by SKB (Swedish nuclear fuel and waste management) and drilled from a tunnel at ~450 m below the surface with a sampling depth in the core of 12 m. A large-area scan of 8 x 2 mm2 was performed on this polished section with 800 x 200 pixels and an integration time of 36 ms per spectrum using a 532 nm excitation wavelength.
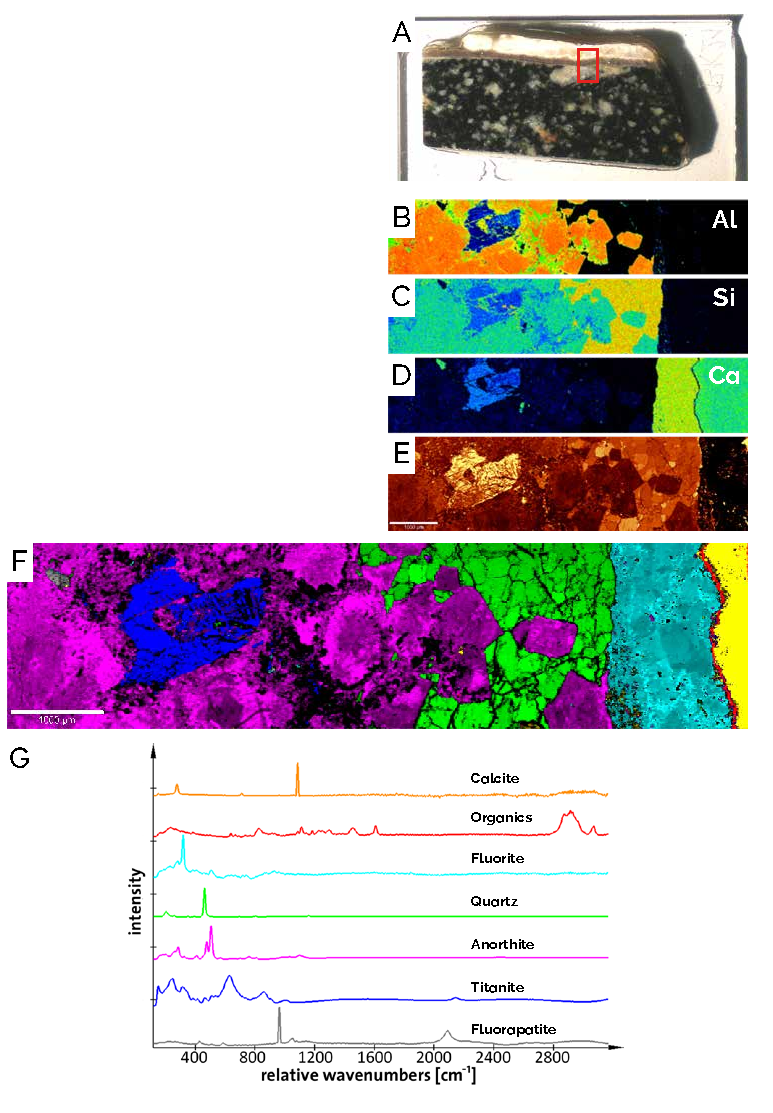
Fig. 1 — Large area EMP and Raman analysis of a diorite sample. (A) Overview of the polished rock section. The red rectangle indicates the analyzed sample area. (B–D) EMP maps showing the elemental distribution for Al (B), Si (C) and Ca (D). (E) Raman image of the same region (integrated intensity from 140 to 300 cm
-1
). (F) Combined false-color Raman image of the same area. The colors correspond to the Raman spectra in (G). (G) Corresponding Raman spectra. Scale bars 1 mm.
Comparing EMP maps of aluminum (Al), silicon (Si) and calcium (Ca) with Raman images of the same area indicated a similar overall chemical contrast (Fig. 1B–F). The color-coded Raman image and corresponding spectra (Fig. 1F, G) revealed the spatial distribution of several mineral phases and were in accordance with the EMP maps. Al was mainly present in the region identified as anorthite, an Al-rich silicate (Fig. 1B, F, G). Accordingly, this phase was also visible in the EMP map of Si (Fig. 1C). Another Si-rich area was identified as quartz (Fig. 1C, F, G) by its Raman spectrum. The Ca-rich regions (Fig. 1D) were identified as titanite, fluorite and calcite (Fig. 1F, G).
In addition to the mineral phases, organic components were identified and located in the sample. The organic material (red in Fig. 1F, G) was present in a narrow layer between two generations of hydrothermal precipitates (fluorite and calcite, cyan and yellow in Fig. 1F, G), indicating at which time a "deep biosphere" was active within these rocks.
More detailed analysis of the data set using the WITec Project software package revealed further information about the mineral phases (Fig. 2). Within the anorthite phase, two distinct spectra could be distinguished, corresponding to different configurations (Fig. 2A, B). In the quartz phase, four regions were identified based on variations in the relative peak intensities (Fig. 2D). Note the discrete edges around the anorthite phase. In the titanite phase, anatase and quartz were present as well as titanite in two distinguishable orientations (Fig. 2E).
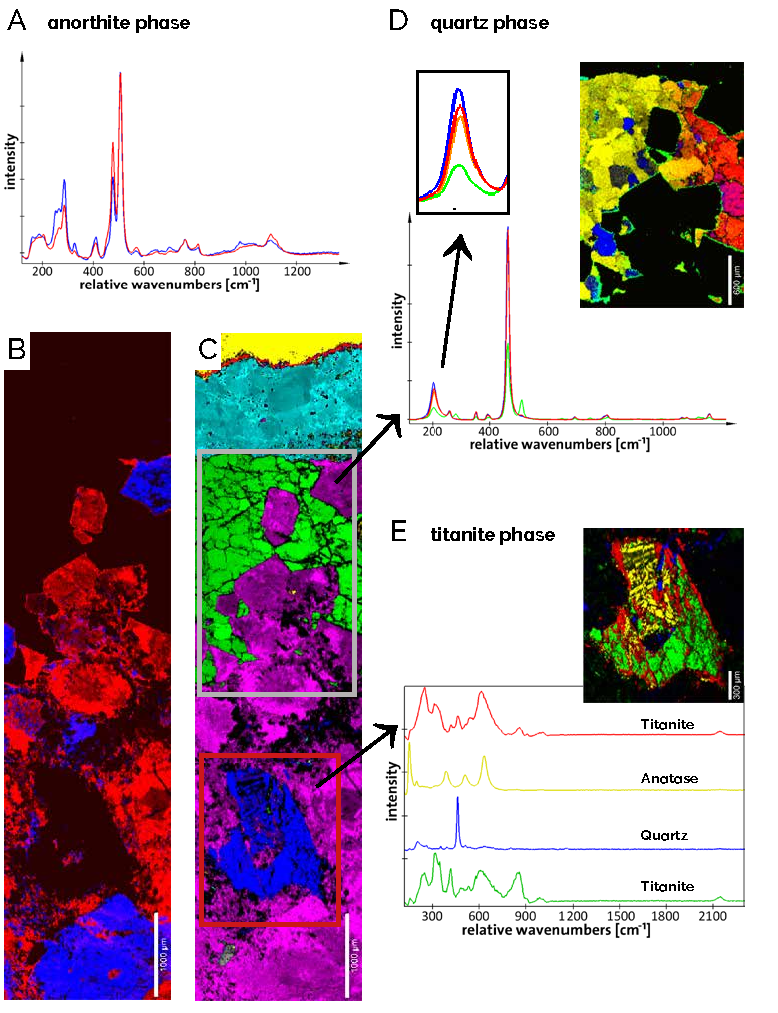
Fig. 2 — Variations in different phases of the diorite sample. (A, B) The anorthite phase: Two distinct spectra (A) with different spatial distribution within the anorthite phase (B). Scale bar in (B) 1 mm. (C) Regions containing quartz (green phase, grey rectangle) and titanite (blue phase, red rectangle) are marked in the combined Raman image and further analyzed (D, E). Scale bar in (C) 1 mm. (D) The quartz phase: Distinct regions show variations of relative peak intensities in the Raman spectra. Note the edges around the anorthite phase. Scale bar 600 µm. (E) The titanite phase contains anatase, quartz and two distinguishable titanite orientations. Scale bar 300 µm.
Raman Imaging with High Spectral and Spatial Resolution
High spectral and spatial resolution is necessary for observing chemical variations when they occur in micron-sized features. The spectral resolution is required to distinguish minor compositional changes, and the spatial resolution enables the depiction of such changes at the required sub-micron level. This is illustrated by small carbonate structures, so-called globules, from the martian meteorite ALH84001 and a terrestrial analogue from Svalbard (mantle peridotite xenolith from the Bockfjorden volcanic complex, BVC) [1].
Fig. 3 shows the results of confocal Raman imaging studies of the carbonate composition in the ALH84001 and the BVC xenoliths undertaken with a Raman microscope offering high spatial and spectral resolution. The two images in Fig. 3A show the overall carbonate distribution (relative intensity integrated over the peaks around 1090 cm-1). The spectra showing the peak positions are depicted in Fig. 3B. The images in Fig. 3C represent shifts of the carbonate peak at about 330 cm-1 and clearly show discrete zones of chemical variation on the sub-micron scale. The letters a, b, c, d represent distinct chemical zones in the carbonate globule of the martian meteorite; the numbers 1 and 2 show zoning in the BVC carbonates. Various carbonate reference samples were measured to demonstrate chemical variation, including calcite (Ca), siderite (Si) and magnesite (Ma) (Fig. 3D). The conclusions drawn from these observations contribute further to understanding the processing of volatile and biologically relevant compounds (CO2 and H2O) on Mars and illustrate the importance of high spectral and spatial resolution in confocal Raman microscopy studies [1].
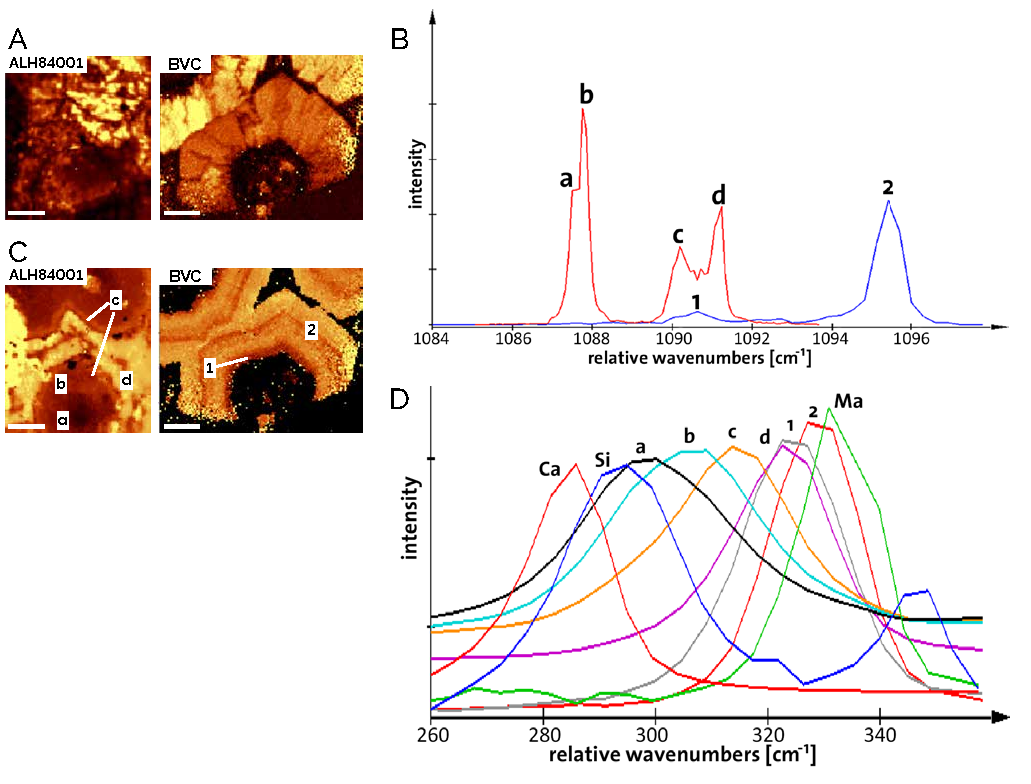
Fig. 3 — Carbonate composition in ALH84001 and BVC xenoliths. (A) Carbonate distribution. Raman intensity integrated over the peak at ~1090 cm-1. (B) Center distribution of the carbonate signal for the images in (A). ALH84001 in red, BVC in blue. The letters a, b, c, d and numbers 1, 2 represent distinct chemical zones in the carbonates (see C). (C) Peak center shift of the carbonate peak at ~330 cm-1 (light color = higher wavenumber). (D) Spectra corresponding to the images in (C). Scale bars 20 µm.
Raman Imaging with High Sensitivity: Revealing Hidden Details
Valuable compositional and structural information may be contained even in the smallest sample volumes. In order to uncover such information and resolve chemical features, the highest possible sensitivity is required in addition to exceptional spectral and spatial resolution. Confocal Raman microscopes of the WITec alpha300 series provide this level of sensitivity, as all parts are optimized for achieving the highest possible throughput of Raman-shifted photons from the sample to the detector. This allows for the analysis of very small and delicate samples without the risk of damaging them. In geosciences, such materials can, for example, be aerosols or interstellar dust particles (IDPs).
Figure 4 shows confocal Raman images of an IDP [2]. The video image gives an overview of the particle (Fig. 4A). The combined false-color Raman image (Fig. 4B) shows that distinct regions for the components shown in Figures 4C, D and E can be separated from each other. Further unidentified mineral phases (Fig. 4C) are separated from hematite/carbon-bearing phases (Fig. 4D) and hematite phases (Fig. 4E) and could be associated with distinct regions on the sample. The corresponding Raman spectra are shown in Figure 4F.
High sensitivity is a prerequisite for differentiating labile components while avoiding sample alteration due to excessive excitation laser energy. This has also been demonstrated on particles returned from comet 81P/Wild2 by the NASA Stardust spacecraft [3]. The study of small, delicate and unstable samples further benefits from Raman imaging being non-destructive, so that samples can subsequently be investigated using invasive micro-analytical techniques (e.g. SIMS, ToFSIMS, TEM, etc.) for obtaining complementary information.
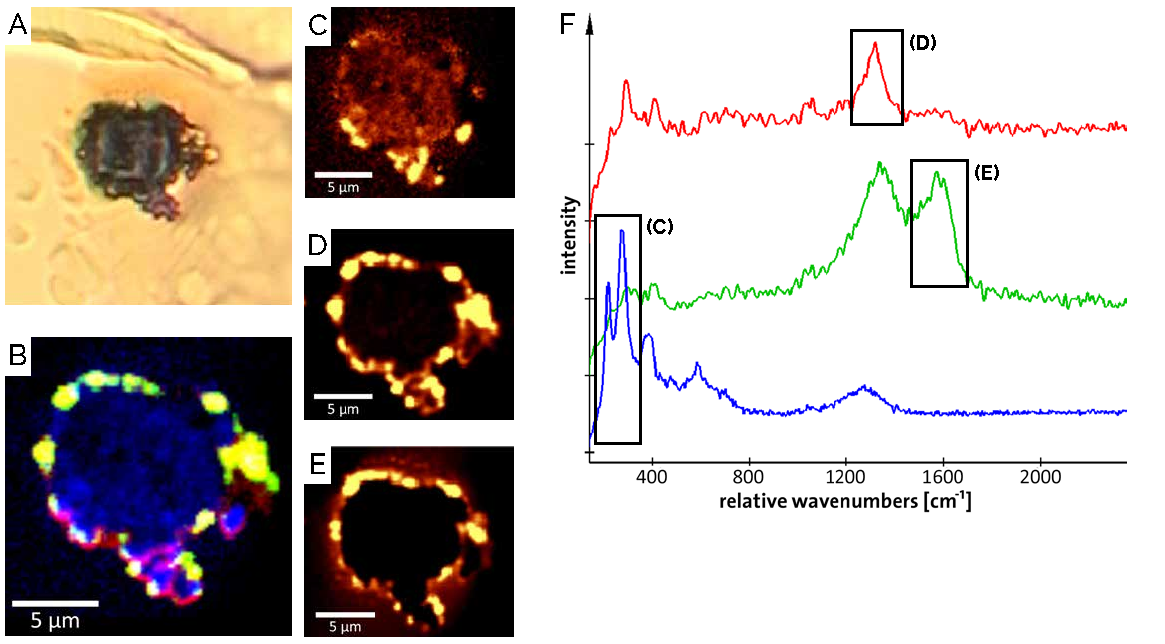
Fig. 4 — Raman analysis of an IDP. (A) Video image of the IDP. (B) Combined false-color Raman image of (C–E). Colors as indicated in the spectra in (F). (C) Relative intensity distribution resulting from integration over the two peaks around 200–300 cm-1 (blue spectrum in F). (D) Relative intensity map of combined hematite / carbon D band phases (1280–1400 cm-1, red spectrum in F). (E) Relative intensity map of hematite phases (peak at ca. 1600 cm-1, green spectrum in F). (F) Corresponding Raman spectra. All scale bars 5 µm.
3D Raman Imaging: Unveil the Information Trapped Inside
2D Raman microscopy visualizes the distribution of chemical compounds on the sample surface or (for transparent samples) in a focal plane below the surface (x-y plane). 3D Raman imaging enables more complex chemical analyses of the components' distribution in the sample volume (x, y and z). This is particularly advantageous for investigating bulky geological specimens, complex emulsions or mixtures, and living organisms.
In order to create 3D images, 2D Raman maps are acquired in different focal planes by automatically scanning through the sample along the z-axis. After data acquisition and processing, a 3D Raman image is generated from the image stack.
Fluid inclusions were discovered in ultra-high pressure (diamond-grade) garnets from the Kokchetav Massif in northern Kazakhstan (samples and data courtesy of Andrey Korsakov, Siberian Branch of the Russian Academy of Science, Novosibirsk, Russia). Characterization of the inclusion's chemical composition and petrographic context may provide information on micro-thermometry. Due to confocality, Raman imaging allows for the non-destructive and non-invasive analysis of such features. The garnet was polished, leaving the inclusion intact some tens of microns below the surface (Fig. 5A). The Raman image (Fig. 5B) revealed significant variations in the relative peak intensities for the garnet across the scanned area (compare the peaks near 850 and 360 cm-1 for the red and magenta spectra in Fig. 5C). The orange spectrum possibly represents a carbonate phase in direct proximity to, or as part of, the inclusion. This variation is confirmed in the depth scan (Fig. 5E, F). Changes in garnet peak intensities appeared only around the inclusion. This may either indicate a differential stress regime due to the influence of the fluid inclusion, or it may be due to slight variations in the garnet composition adjacent to the inclusion. Interestingly, the aqueous phase also showed significant variations, as shown by the Raman spectra (Fig. 5D, G). These variations may be attributed to the presence of H2O in liquid and gaseous phases, or the presence of hydrous silicate phases.
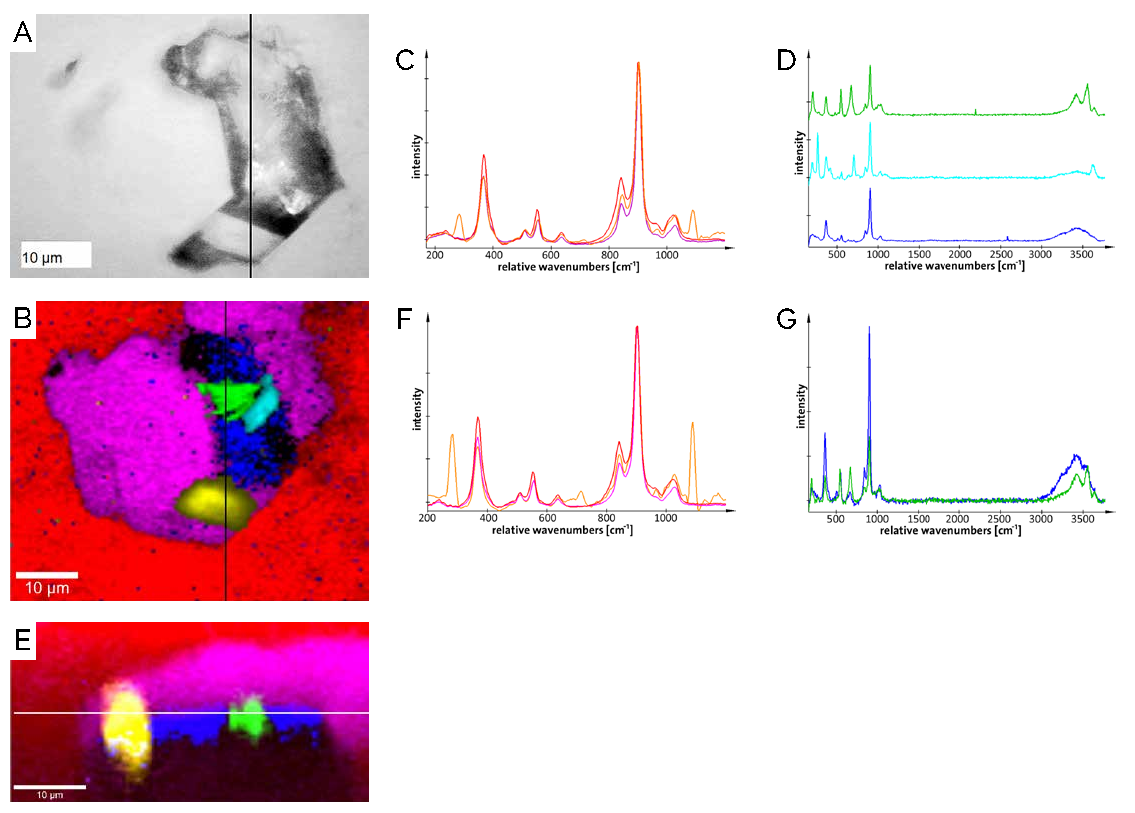
Fig. 5 — Fluid inclusion in garnet. (A) Video image showing the sub-surface inclusion. The black line indicates the location of the X-Z scan in (E). (B–D) Combined false-color Raman image (B) and corresponding Raman spectra of the garnet and carbonate phase (C) (red, orange, pink) and of the aqueous phase (D) (green, cyan, blue). (E–G) Combined false-color Raman image (E) for the X-Z scan along the black line in (A) and corresponding Raman spectra (F, G). Scale bars 10 µm. The spectra in (C) and (F) are normalized to the peak near 900 cm
-1
.
In the previous example, 3D information from a garnet sample was gained by recording one Raman image in the X-Y plane and one orthogonal to it in the X-Z plane. However, an even more complete picture of the material distribution can be obtained from a 3D representation of the sample. This is possible using 3D Raman imaging, where 2D images are recorded from several focal planes and a 3D representation of the sample volume is created from the image stack.
Fig. 6 exemplarily shows the 3D Raman image of a fluid inclusion in garnet. It reveals the fluid water inclusion (blue) surrounded by garnet (red), calcite (green) and mica (cyan).
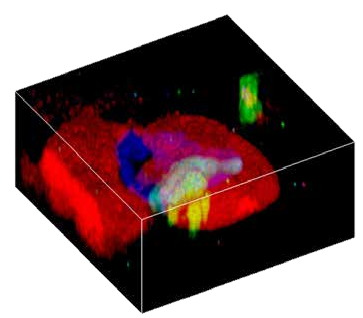
Fig. 6 — 3D confocal Raman image of a fluid inclusion in garnet. Water inclusion (blue) in garnet (red), calcite (green) and mica (cyan). Scan range: 60 x 60 x 30 µ
3.
Asbestos Fibers in Mineral Matrices
Asbestos refers to a group of six silicate minerals which form fibers. Due to its flexibility, strength and heat-resistance, asbestos was a very popular building material. However, its use is now banned in many countries because all asbestos forms are highly carcinogenic. Therefore the detection of asbestos fibers is necessary in materials intended for construction, such as stone from quarries, and also the previously installed materials in old buildings. Their detection is often challenging because the fibers' diameters are usually only a few hundred nanometers.
Together with the BRGM, the French national geological survey office, we recently demonstrated the utility of combined 3D Raman imaging and scanning electron microscopy (SEM) for identifying and characterizing asbestos-like fibers in different rock samples [4]. 3D Raman measurements revealed the shape of the fibers within the mineral matrices and identified the chemical composition of the fibers and the matrix.
Such a 3D analysis allows for the calculation of the aspect ratios and volume fractions of the asbestos fibers. Fig. 7 shows actinolite asbestos fibers (red) in an orthoclase (blue) and calcite (green) matrix [4]. With an integration time of 100 ms per spectrum, the entire 3D image was acquired in only about 2 hours.
The measurements were performed using a combined Raman Imaging and Scanning Electron (RISE) microscope (WITec and Tescan). Thus, SEM and Raman images could be obtained from the same sample position, which enabled the correlation of the structural information from SEM with the chemical information from Raman imaging [4].
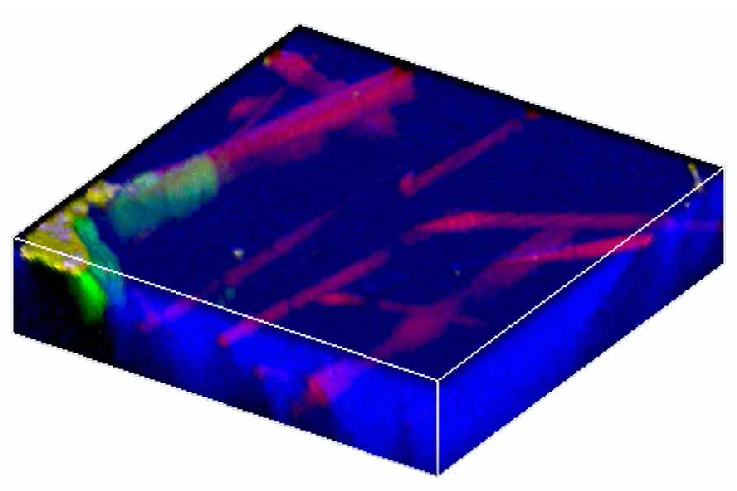
Fig. 7 — Volume analysis of asbestos fibers in a mineral matrix. Actinolite asbestos fibers (red) are surrounded by a matrix comprised of orthoclase (blue) and calcite (green). Image size 60 x 60 x 20 µm3.
Topographic Confocal Raman Imaging with TrueSurface™
TrueSurface™ is an optical profilometry technology pioneered by WITec. It enables confocal Raman microscopy on roughly textured and tilted samples by keeping their surfaces constantly in focus. Thus, it is extremely useful for geological samples.
Fig. 8 illustrates topographic Raman imaging on an inclined and rough rock sample from the Doushantuo formation in China (Fig. 8A, B). The height profile (Fig. 8C) was recorded simultaneously with the Raman spectra at each image point and represents the rough surface topography in the measurement area. The topographic Raman image (Fig. 8D) shows the chemical information overlaid on the height profile.
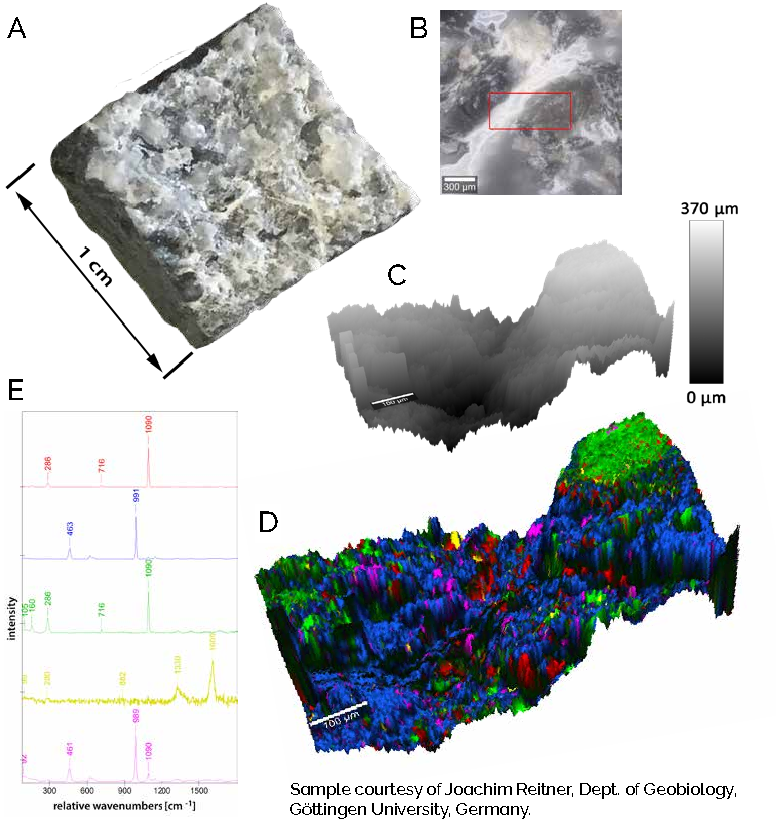
Fig. 8 — Raman imaging of a rough rock. (A) Photograph of the sample, a cap carbonate rock from the Doushantuo formation (Yichang, China). (B) White-light image of the sample. The red rectangle marks the position of the topographic Raman measurement. (C) Height profile of the rock. Scale bar 100 µm. (D) Topographic Raman image, in which topography and chemical information are overlaid. The colors correspond to those of the Raman spectra in (E). Scale bar 100 µm. (E) Raman spectra: red = ankerite, blue = barite, green = dolomite, pink = Al2[SO4]3, yellow = unidentified phase.
Correlative Raman Imaging: Maximizing the Information Gain
Due to its non-destructive and label-free nature, confocal Raman imaging is ideally suited for correlative imaging techniques, which greatly enhance the insight gained from an investigation. Raman imaging can for example be combined with various light microscopy techniques, with atomic force microscopy (AFM), scanning near-field optical microscopy (SNOM) and scanning electron microscopy (SEM). Thus, high-resolution chemical and structural sample information can be obtained from the same sample area with one instrument. The efficient workflow of correlative microscopy techniques is an additional advantage that saves time and money.
Raman Imaging and Scanning Electron (RISE) Microscopy of a Geological Sample
Raman Imaging and Scanning Electron (RISE) microscopy integrates the sensitivity of the non-destructive, spectroscopic Raman technique and the atomic resolution of scanning electron microscopy (SEM) in one instrument. Due to an intelligent and automatic sample positioning system, RISE microscopy enables diffraction-limited confocal Raman imaging and SEM at exactly the same area of interest.
The power of RISE microscopy is illustrated by analyzing the mineral phases of a rock section from a drill core. The dominant rock type is diorite. The sample was not treated or vaporized but only sectioned with a diamond saw under water. This reduces the risk of contaminating the surface, which is of great importance for geological drill cores, but also for objects obtained from the deep sea.
Fig. 9A shows the SEM image of a small sample area recorded using the back-scattered electron detector of the SEM. The same area was analyzed using energy-dispersive X-ray spectroscopy (EDX/EDS) (Fig. 9B). The distribution of elemental groups indicates the presence of three distinct minerals. Single Raman spectra were acquired from the three different areas, three of which show the characteristic Raman bands for quartz, epidote and plagioclase (Fig. 9C). This is in good agreement with the elemental composition obtained by EDX. Raman spectra of the three primary minerals were evaluated using cluster analysis. Four more spectra were detected, two of which may correspond to different grain orientations within the epidote and plagioclase phases, respectively. The spatial distribution of the minerals is shown in the color-coded RISE image (Fig. 9D), in which the colors of the Raman image correspond to those of the Raman spectra (Fig. 9C). In addition to the spatial distribution of the mineral phases, small grains within a mineral phase could be detected. Fig. 9E shows the white-light image acquired from the same sample area as the SEM image. It emphasizes that high-resolution optical images require proper focusing, whereas SEM is completely insensitive to surface roughness. Thus, it is difficult to retrieve the sample area when using two stand-alone instruments.
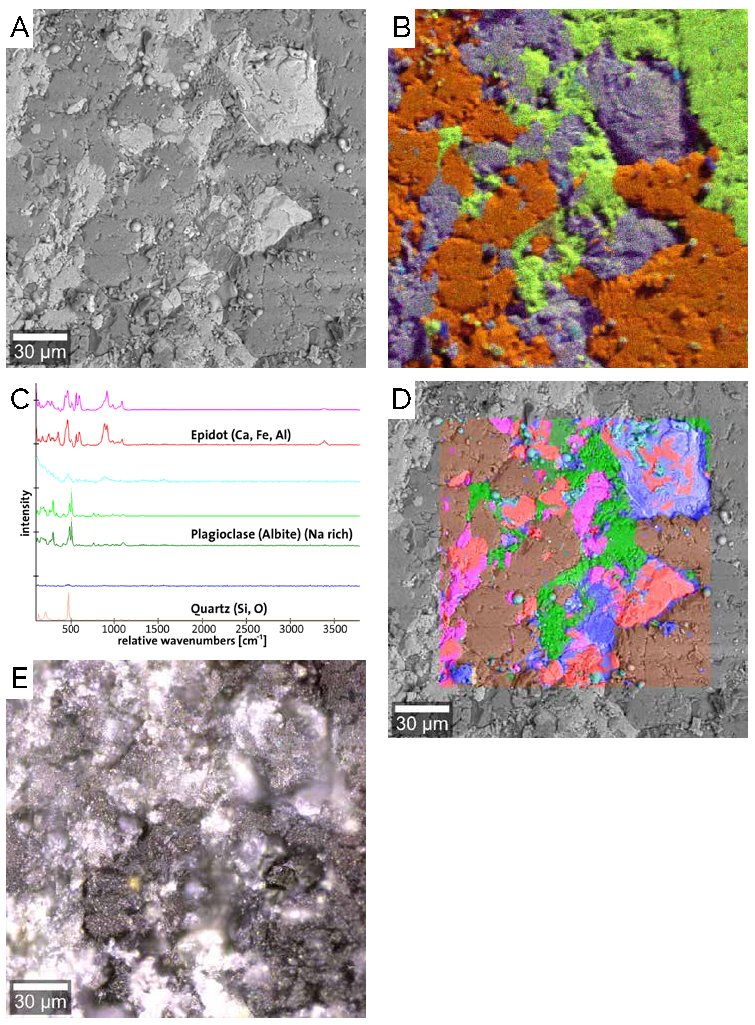
Fig. 9 — Mineral phases in a diorite rock section. (A) SEM image. (B) Overlay of SEM and EDX images. Three element groups could be distinguished with EDX: Si, O (orange); Ca, Fe, Al (grey-purple); Na (green). (C) Raman single spectra acquired from the three distinct regions with the characteristic Raman bands of quartz (brown), epidot (red) and plagioclase (green). (D) RISE image: Overlay of Raman and SEM image. The colors of the Raman image correspond to those of the spectra in (C). Raman image parameters: 100 x 100 µm2, 150 x 150 pixels = 22,500 spectra, integration time 80 ms per spectrum. (E) White-light microscopy image of the same sample area.
Raman Imaging and Scanning Electron (RISE) Microscopy of Hematite
A piece of hematite (Fe2O3) was analyzed by SEM and then with the integrated confocal Raman microscopy function of the RISE microscope. SEM reveals structural characteristics, but cannot differentiate between the different oxides present in the hematite. However, the Raman spectra indicate the occurrence of several crystal forms of hematite and of goethite (FeO(OH)). The distribution of these minerals is shown in the Raman image that has been overlaid onto the SEM image (Fig. 10).
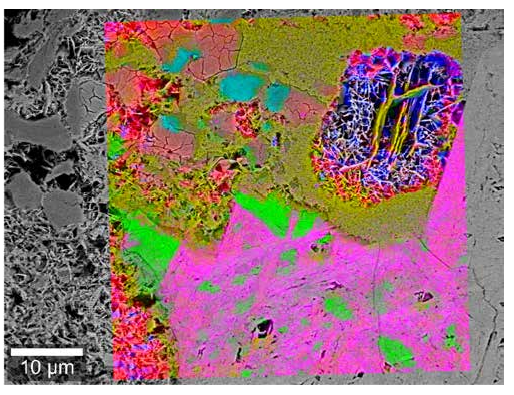
Fig. 10 — RISE (Raman-SEM) image of hematite. The sample consists of several crystal forms of hematite (red, blue, green, orange, pink) and of goethite (light blue, cyan). The Raman image was overlaid onto the SEM image. Raman imaging parameters: 50 x 50 µm2; 150 x 150 spectra, integration time: 150 ms/spectrum, 10 mW laser power.
Atomic Force Microscopy of Fossils
Atomic force microscopy (AFM) is a non-destructive imaging technique for surface characterization on the nanometer scale. In addition to high-resolution topography images, local material properties such as adhesion or stiffness can be investigated by analyzing the tip-sample interaction forces. Fig. 11 shows AFM images of silicified bacteria. Cellular structures can't be distinguished in the topography image (Fig. 11A), but are revealed in the image of different adhesion levels (Fig. 11B).
AFM is combinable with confocal Raman imaging in one instrument. Thus, AFM and Raman images can be obtained from the same sample area, making it possible to correlate the structural and chemical information.
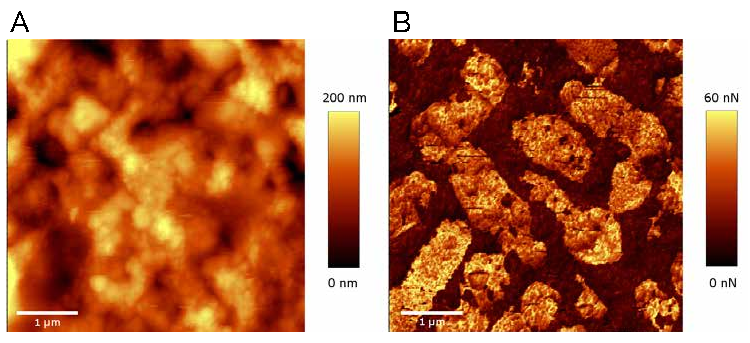
Fig. 11 — AFM images of silicified bacteria. (A) Topography AFM image. Cell structures can not be recognized from the topography. (B) The AFM image recorded in Digital Pulsed Force Mode shows the different adhesion levels and reveals the cell structures of the bacteria. Scale bars 1 µm.
References
- Steele A. et al. (2007) Meteoritics and Planetary Science
- 42: 1549–1566. DOI: 10.1111/j.1945-5100.2007.tb00590.x
- Toporski J. et al. (2004) Sweeping the skies: Stardust and the origin of our Solar System. Imaging & Microscopy
- 04/2004: 38–40.
- Rotundi A. et al. (2008) Meteoritics and Planetary Science
- 43: 367–397. DOI: 10.1111/j.1945-5100.2008.tb00628.x
- Wille G. et al. (2019) Journal of Hazardous Materials
- 374: 447–458. DOI: 10.1016/j.jhazmat.2019.04.012
Further Reading
J. Toporski, T. Dieing, O. Hollricher, eds. Confocal Raman Microscopy.
2nd ed. 2018, Springer International Publishing AG. DOI: 10.1007/978-3-319-75380-5.

