Confocal Raman microscopy is a label-free and non-destructive technique that enables 2D and 3D measurements on biological samples both in vivo and in vitro. It can be seamlessly combined with other techniques for a comprehensive analysis of the samples. Such a combination allows for obtaining metabolic, structural, mechanical, topographical and other kind of information from cells, organoids, tissues, and other types of biological samples.
Life sciences investigate the wide variety of living organisms, ranging from subcellular structures to large biological systems. In this field, Raman microscopy has emerged as a powerful tool that complements established methods by revealing hidden details about the molecular composition of samples. Researchers across multiple disciplines, such as medicine, tissue engineering, microbiology, neuroscience, cell biology and ecology, are increasingly utilizing Raman microscopy. They investigate complex structures, study biomolecules such as nucleic acids, lipids and proteins, analyse cellular dynamics and metabolism, visualize drug effects and identify pathogens and biomarkers1-14.
The following examples demonstrate the complementary nature of different imaging modalities available on the witec360 correlative and confocal Raman imaging microscope platform. By combining confocal Raman imaging with widefield light microscopy, fluorescence imaging, higher harmonic generation, and topographic mapping, a more comprehensive understanding of a wide range of samples can be achieved.
3D confocal Raman imaging of cells
3D Raman imaging of single cells, both in vivo and in vitro, is made possible by the strong background suppression inherent to the high confocality of the witec360 Raman microscopes. Thus, structural and biochemical information about the sample is obtained without the need for extensive preparation or labeling of the sample. Depending on the researchers’ requirements, measurements can be conducted in the upright or inverted microscope configuration, with the most suitable objective selected for optimal performance (air, immersion, or dip-in).
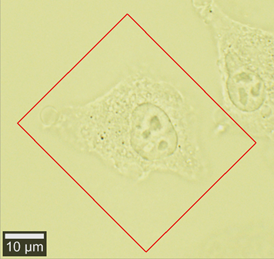
Figure 1 shows the bright field image and the reconstructed 3D Raman image of an A549 lung carcinoma epithelial cell (564,000 spectra). Raman spectra were analyzed via the TrueComponent analysis in the PROJECT software. The 3D Raman image, revealing the inner structure of the cell, was reconstructed in the Imaris 10.2 software. The measurement area is indicated within the video image. As all relevant data are integrated into a single software environment, correlation and analysis are straightforward and efficient.
A)
B)
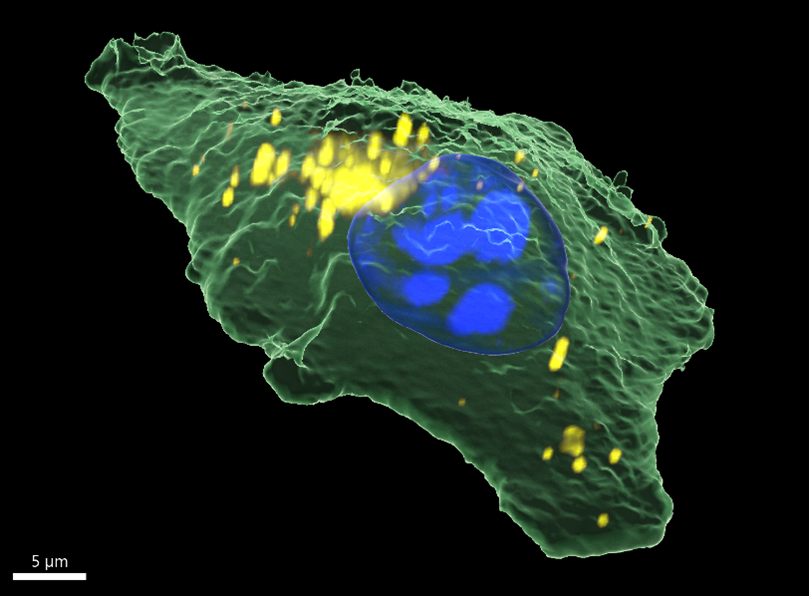
Figure 1: 3D Raman imaging of an A549 cell
(A) Video image of an A549 in cell culture. (B) Color-coded 3D Raman image generated from the basic spectra obtained by TrueComponent analysis. Nucleoli in blue, cytoplasm in green and vesicles in yellow.
Sample courtesy of Dr. Irina Estrela-Lopis and Tom Venus, Leipzig University, Institute for Medical Physics and Biophysics.
White light and fluorescence widefield imaging
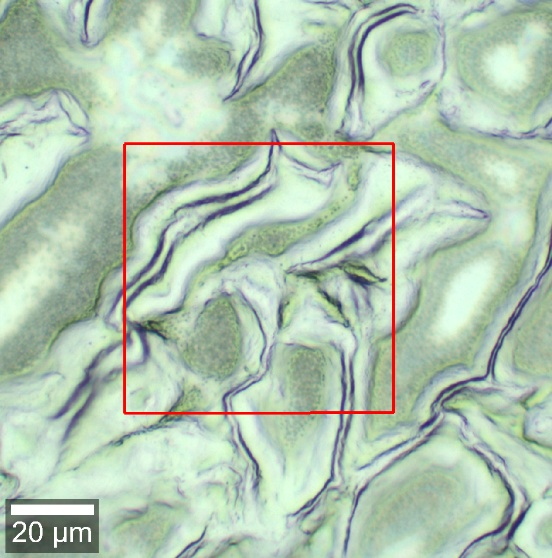
Each Raman measurement is typically preceded by widefield white light imaging, which provides an overview of the sample to easily define the regions of interest. The witec360 confocal Raman imaging microscope enables excellent visualization even of low contrast features, as often observed for biological samples under white light illumination. In addition, contrast-enhancing techniques such as differential interference contrast (DIC) or darkfield are available to resolve specific structural details of the samples. Transmission and reflection modes, brightfield, darkfield, DIC (differential interference contrast) and combinations thereof complete the wide range of imaging modes that help to highlight structural details of biological samples like cells and tissues.
A comparison of the white light images obtained with different widefield techniques available with witec360 is shown in Figure 2.
A)
B)
C)
D)
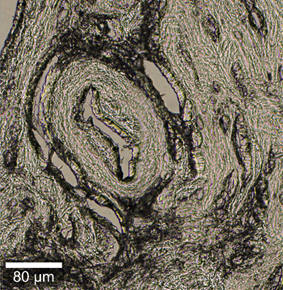
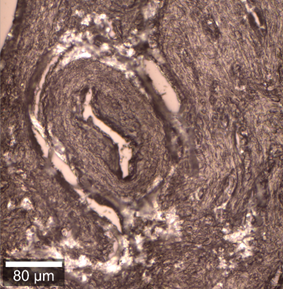
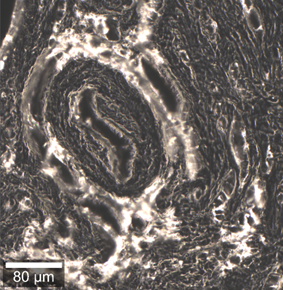
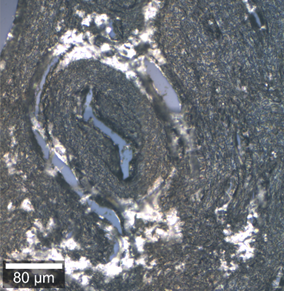
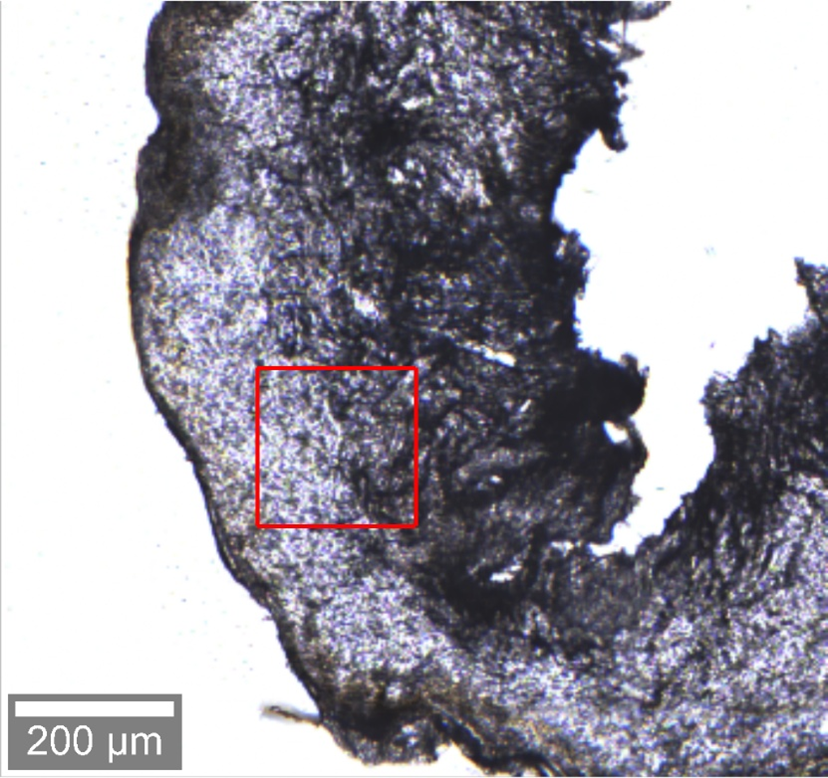
Figure 2: Widefield imaging of a uterine tube
Brightfield (A), darkfield (B), and brightfield DIC (C) video images of a uterine tube measured in reflected light. (D) Brightfield video image of a uterine tube measured in transmitted light.
Sample courtesy of Ana-Maria Trunfio-Sfarghiu (INSA, Lyon) and Mickaël Catinon (Minapath Groupe Adène, Lyon) [15].
Fluorescent tags are widely used in life science research to selectively visualize cell organelles and specific molecules. In the witec360 confocal Raman imaging microscope, widefield fluorescence microscopy is seamlessly combined with Raman microscopy. It can be employed to navigate around the sample to find the region of interest and examine it with Raman microscopy. The generally weak Raman signal is accessible if fluorescent labels are selected such that they are not excited with the laser wavelength used for Raman analysis. Figure 3 shows an example of the fluorescence image obtained in the widefield mode and can be used for navigation in the further analysis of the cell.
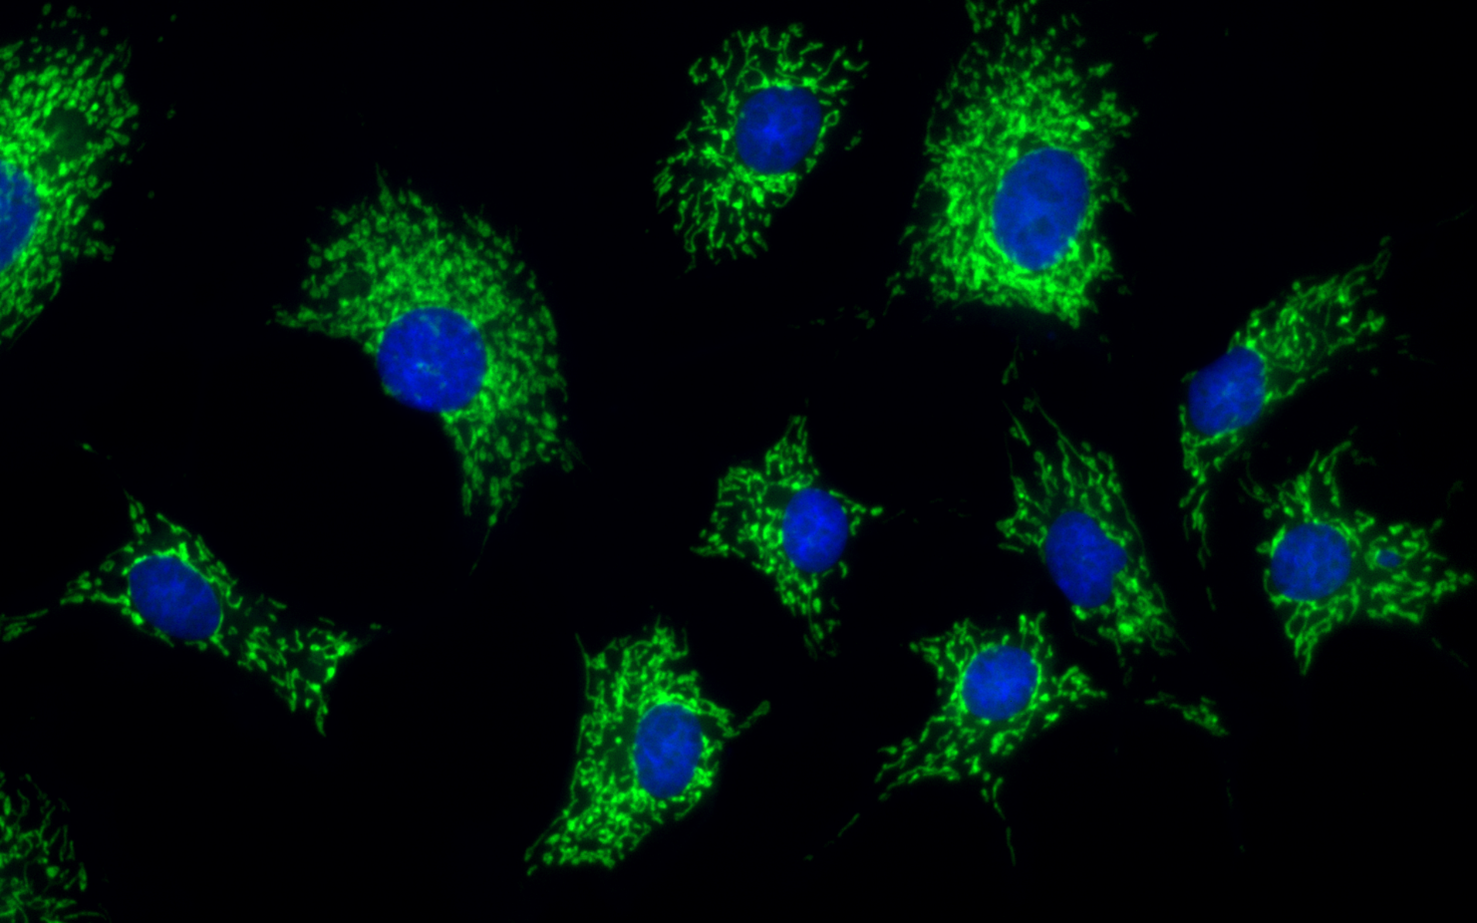
Figure 3: Widefield fluorescence imaging of eukaryotic cells
(A) Brightfield fluorescence image of fixed rat endothelial cells. Actin filaments labeled with phalloidin (green) nuclei labeled with DAPI (blue).
Sample courtesy of Oxford Instruments.
Higher harmonic generation microscopy
Second harmonic generation (SHG) and third harmonic generation (THG) are nonlinear multiphoton excitation methods that are widely used in life science research for label-free imaging of molecules and structures in cells and tissues. In SHG measurements, the sample is illuminated with a pulsed NIR laser to achieve high excitation density. The SHG signal is recorded at twice the excitation frequency (half of the wavelength). In THG, accordingly, the recorded signal is three times the frequency (one third of the excitation wavelength) of the excitation.
In tissue samples, SHG microscopy visualizes the collagen structure16. In combination with a highly confocal system, it allows probing the three-dimensional structure of tissue with sub-micrometer depth resolution. The illustration of that is shown in Figure 4, where a 3D image of the skin tissue is presented (3,600,000 spectra).
A)
B)
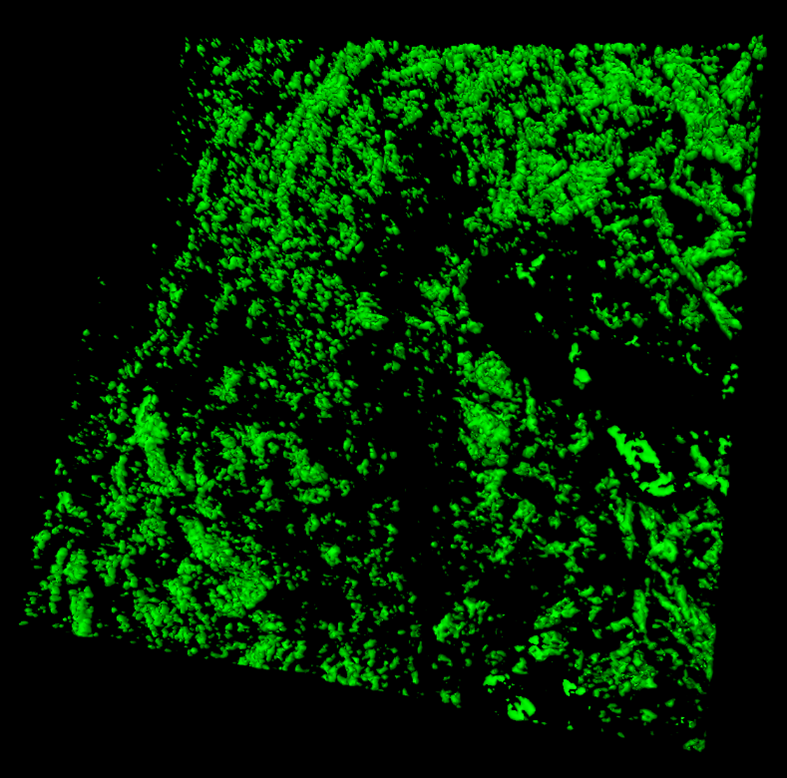
Figure 4: SHG imaging reveals the 3D structure of collagen in skin tissue
(A) Brightfield video image of a skin tissue sample in transmitted light. (B) High-resolution 3D image of collagen distribution in the skin tissue sample from a confocal SHG imaging.
Sample courtesy of DDRUG research group at University of Milan (contact name: Prof. Umberto M. Musazzi).
A THG signal is generated at interfaces where a change in the material’s refractive index occurs, such as between aqueous and lipid structures in biological tissues. Figure 5 below shows an example of THG signal acquisition in subcutaneous tissue (1,901,250 spectra). The 3D THG image was reconstructed in Imaris 10.2 software.
A)
B)
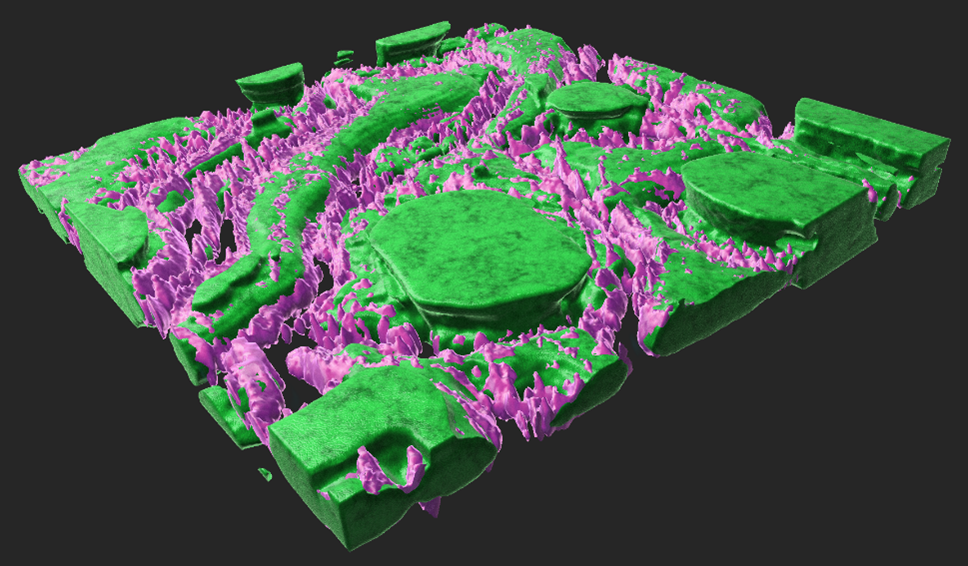
Figure 5: THG imaging of subcutaneous tissue
(A) Brightfield video image of a subcutaneous tissue sample. (B) 3D image of adipocyte cells distribution in the subcutaneous tissue sample from confocal THG imaging. Cells are shown in green and cell membranes in purple. Dimensions: 65 x 65 x 7 µm³
Sample courtesy of Prof. Jiang Chunhuan, Changchun Institute of Applied Chemistry, CIAC CAS.
Topographical imaging
In some cases, detailed topographic and mechanical information about the sample surface is of great value for a comprehensive understanding of a specimen. Two options are available on the witec360 correlative and confocal Raman imaging microscope platform: atomic force microscopy (AFM) and TrueSurface optical profilometry.
Atomic force microscopy provides a high-resolution image of the sample’s surface, information about topography, and sample properties like stiffness and adhesion are available. AFM measurements can be combined with other methods to obtain comprehensive information about the sample.
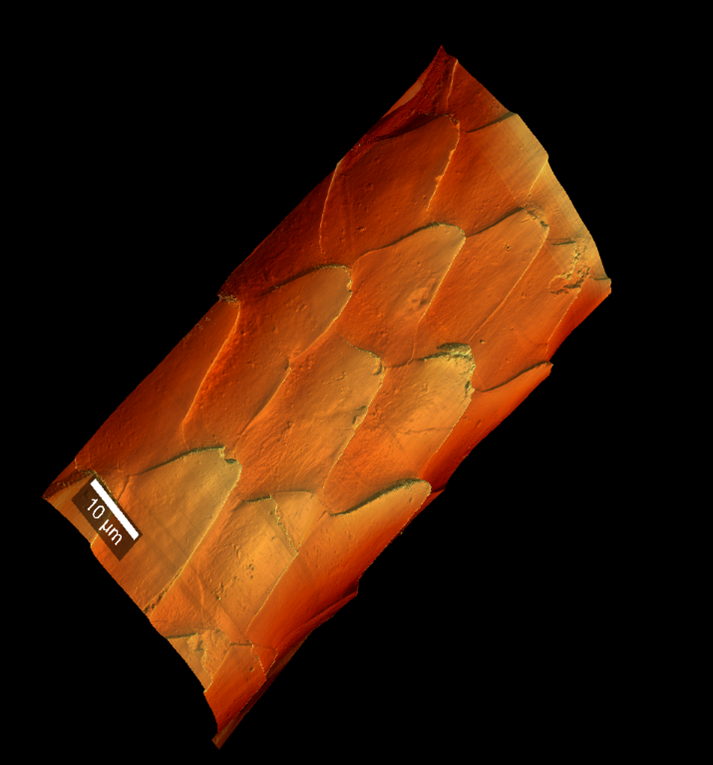
Figure 6 features an AFM topography image of a cat's hair, that consists of keratin and has a spinous structure of the cuticle (Figure 6 A). 3D Raman imaging of the same hair (Figure 6 B) allowed to image the inner cortex cell structure in addition to the cuticle on the surface. To enhance visibility, the 3D presentation includes a sectional cut that reveals the inner cortex cell structure, shown in blue. The 3D Raman image was reconstructed using Imaris 10.2 software, also the cut position was defined there.
A)
B)
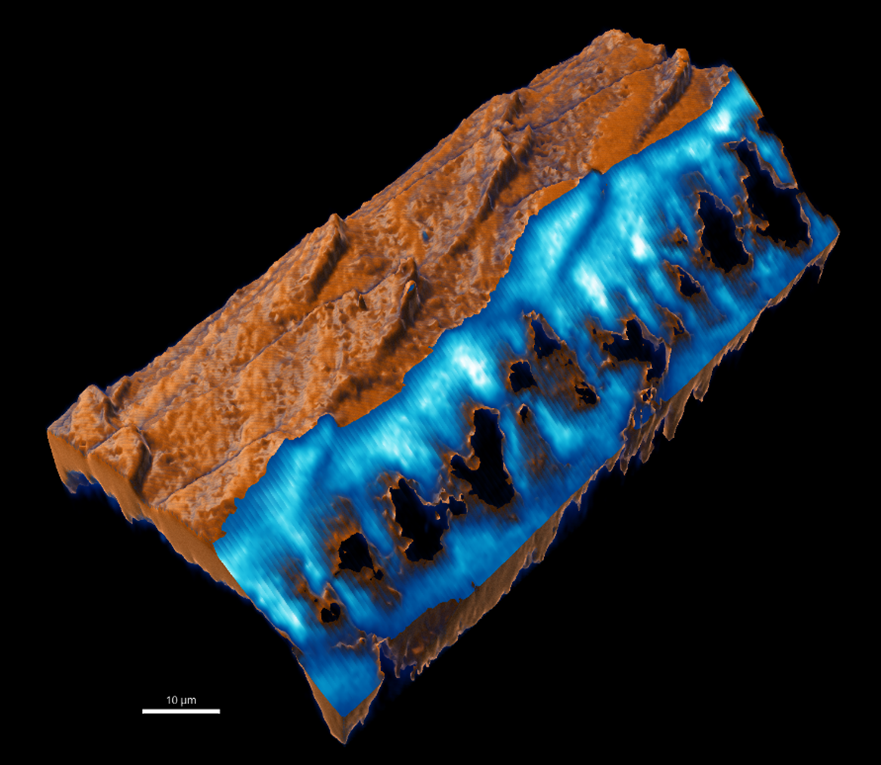
Figure 6: AFM and 3D Raman imaging of cat hair
(A) AFM image of a cat's hair. (B) 3D Raman image of a cat hair with the cuticle in brown and the cortex in blue.
Sample courtesy of Oxford Instruments.
To image a larger area of structured or rough samples, a live focus mechanism is required to follow the surface and keep the sample in focus at any time. With the witec360 confocal Raman imaging microscope, this is facilitated by TrueSurface, an optical profilometry module that allows for simultaneous acquisition of Raman signal and topography. Acquisition and correlation of spectroscopic and topographic data is easy and straight forward, as all is seamlessly integrated into a single software solution.
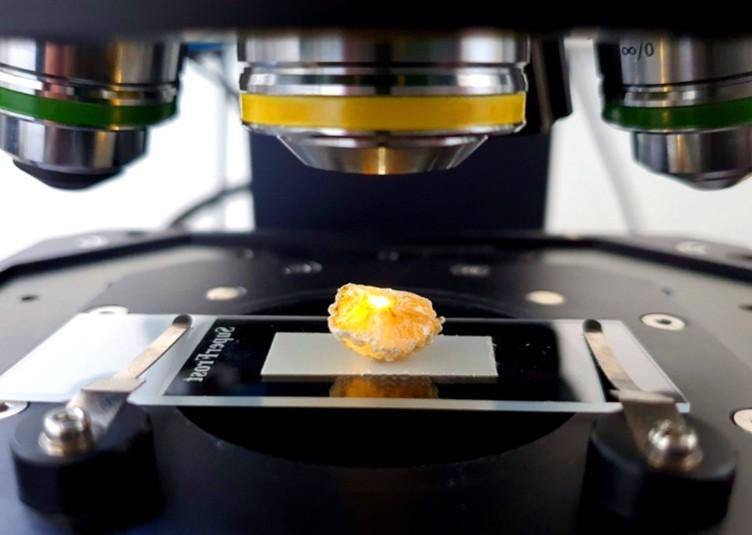
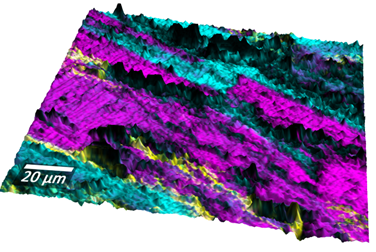
An example of topography and Raman image overlay is shown in Figure 7 B, where an image of a cholesterol gallstone is showcased. The main chemical components of the gallstone are two cholesterol derivatives (cyan and pink), identified by comparing the Raman spectra with available databases in TrueMatch software. The overlay of the Raman image with the video image is shown in Figure 7 C.
A)
B)
C)
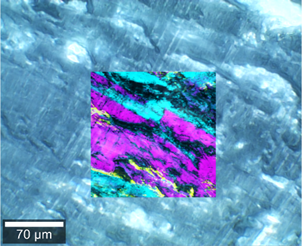
Figure 7: Correlative topography, Raman and video imaging of a gallstone
(A) Gallstone sample in the microscope. (B) Topography and Raman image overlay. (C) Video image and Raman image overlay. Two cholesterol derivatives are colored in cyan and pink in the Raman image.
Sample courtesy of Miriam Böhmler, Oxford Instruments.
To achieve the best results from your samples, Oxford Instruments’ witec360 correlative and confocal Raman imaging microscopes deliver Raman technology with exceptional resolution, speed and sensitivity. This high performance enables the protection of biological specimens by minimizing the required laser exposure. Thanks to their modular architecture, witec360 confocal Raman imaging microscopes offer unparalleled versatility to meet your current and future research demands with confidence. The newly developed Hexalight spectrometer, featuring up to six gratings within a single turret and with automatic, ultra-fine grating without manual intervention, enables performance optimization across an extended spectral range – simplifying both system complexity and user handling. This makes it an ideal solution for core facilities. Moreover, the modular design ensures long-term adaptability through straightforward upgrade options, safeguarding your investment for the future.
References
- Abramczyk, H., et al. (2019). Advances in Raman imaging combined with AFM and fluorescence microscopy are beneficial for oncology and cancer research. Nanomedicine, 14(14), 1873-1888. DOI: 10.2217/nnm-2018-0335.
- Haessler, A., Candlish, M., Hefendehl, J. K., Jung, N., & Windbergs, M. (2024). Mapping cellular stress and lipid dysregulation in Alzheimer-related progressive neurodegeneration using label-free Raman microscopy. Communications Biology, 7(1), 1514. Doi: 10.1038/s42003-024-07182-6
- Høgset, H., Horgan, C. C., Armstrong, J. P., Bergholt, M. S., Torraca, V., Chen, Q., ... & Stevens, M. M. (2020). In vivo biomolecular imaging of zebrafish embryos using confocal Raman spectroscopy. Nature Communications, 11(1), 6172. DOI: 10.1038/s41467-020-19827-1
- Horgan, C. C., Nagelkerke, A., Whittaker, T. E., Nele, V., Massi, L., Kauscher, U., ... & Stevens, M. M. (2020). Molecular imaging of extracellular vesicles in vitro via Raman metabolic labelling. Journal of Materials Chemistry B, 8(20), 4447-4459. DOI: 10.1039/d0tb00620c
- Jung, N., Namjoshi, S., Mohammed, Y., Grice, J. E., Benson, H. A., Raney, S. G., ... & Windbergs, M. (2022). Application of confocal Raman microscopy for the characterization of topical semisolid formulations and their penetration into human skin ex vivo. Pharmaceutical research, 39(5), 935-948. 10.1007/s11095-022-03245-7
- Karlo, J., Gupta, A., & Singh, S. P. (2024). In situ monitoring of the shikimate pathway: a combinatorial approach of Raman reverse stable isotope probing and hyperspectral imaging. Analyst, 149(10), 2833-2841. DOI: 10.1039/D4AN00203B
- Orleanska, J., Wiecek, W., & Majzner, K. (2024). Investigation of etravirine uptake and distribution in single aortic endothelial cells in vitro using Raman imaging. Analyst, 149(17), 4454-4463. DOI: 10.1039/D4AN00314D
- Sasani, N., et al. (2021). Raman imaging reveals in-situ microchemistry of cuticle and epidermis of spruce needles. Plant Methods, 17, 1-15. DOI: 10.1186/s13007-021-00717-6.
- Stanek, E., Czamara, K., & Kaczor, A. (2024). Increased obesogenic action of palmitic acid during early stage of adipogenesis. Biochimica et Biophysica Acta (BBA)-Molecular and Cell Biology of Lipids, 159525. https://doi.org/10.1016/j.bbalip.2024.159525
- Stiebing, C., et al. (2020). Biochemical characterization of mouse retina of an Alzheimer’s disease model by Raman spectroscopy. ACS Chemical Neuroscience, 11(20), 3301-3308. DOI: 10.1021/acschemneuro.0c00420.
- Sugiyama, K., et al. (2021). Raman microspectroscopy and Raman imaging reveal biomarkers specific for thoracic aortic aneurysms. Cell Reports Medicine, 2(5).
- Unger, N., et al. (2022). Looking Inside Non-Destructively: Label-Free, Raman-Based Visualization of Intracellular Coxiella burnetii. Analytical Chemistry, 94(12), 4988-4996. https://doi.org/10.1021/acs.analchem.1c04754
- van der Meijden, R. H., Daviran, D., Rutten, L., Walboomers, X. F., Macías‐Sánchez, E., Sommerdijk, N., & Akiva, A. (2023). A 3D cell‐free bone model shows collagen mineralization is driven and controlled by the matrix. Advanced Functional Materials, 33(42), 2212339. https://doi.org/10.1002/adfm.202212339
- Zbinden, A., Marzi, J., Schlünder, K., Probst, C., Urbanczyk, M., Black, S., ... & Loskill, P. (2020). Non-invasive marker-independent high content analysis of a microphysiological human pancreas-on-a-chip model. Matrix Biology, 85, 205-220. DOI: 10.1016/j.matbio.2019.06.008
- Catinon, Mickaël et al. (2020). Identification of inorganic particles resulting from degradation of ESSURE® implants: Study of 10 cases. European Journal of Obstetrics and Gynecology and Reproductive Biology, Volume 250, 162 – 170. https://doi.org/10.1016/j.ejogrb.2020.04.036
- Cicchi, R., Vogler, N., Kapsokalyvas, D., Dietzek, B., Popp, J. and Pavone, F.S. (2013), From molecular structure to tissue architecture: collagen organization probed by SHG microscopy. J. Biophoton., 6: 129-142. https://doi.org/10.1002/jbio.201200092

