Application Notes
Complementary Droplet Size and Microstructure Analysis of Food Emulsions with TD-NMR and Raman Imaging
Author: Tatiana Monaretto
Published: 05 Nov 2026 · Last updated: 06 Nov 2026
Abstract
This study shows how combining Raman imaging and MQC-R Time-Domain Nuclear Magnetic Resonance (TD-NMR) provides complementary information about the structure and composition of food emulsions, using margarine and mayonnaise as examples.
TD-NMR characterises the bulk droplet size distribution, while Raman imaging resolves local droplet structure and chemical composition. Both techniques identified larger characteristic droplets in mayonnaise than in margarine. TD-NMR also provided the volume-weighted mean droplet diameter (D33), an important parameter for monitoring formulation- and processing-related changes in food emulsions, while Raman imaging revealed the spatial distribution of chemically distinct components.
Together, the techniques provide a more comprehensive understanding of food emulsion structure, functionality, processing effects, and quality.
Introduction: Emulsion Microstructure
Emulsion microstructure plays a key role in determining physical properties, stability, appearance and overall product quality. Droplet size is an important aspect of this structure, as differences in droplet dimensions and size distribution can reflect changes in formulation and processing. Characterising these features is therefore valuable when comparing formulations and evaluating product performance.
Margarine and mayonnaise are examples of emulsions with reversed dispersed and continuous phases: margarine is a water-in-oil emulsion, whereas mayonnaise is an oil-in-water emulsion. This study uses these contrasting systems to investigate whether TD-NMR and Raman imaging identify comparable droplet size trends and to examine the additional structural and chemical insight gained by combining the techniques.
Why combine TD-NMR and Raman Imaging for Food Emulsion Analysis?
Raman imaging and TD-NMR provide complementary perspectives on food-emulsion structure.
Raman imaging provides label-free, spatially resolved visualisation of emulsion components. Three-dimensional Raman images can reveal differences in fat-network morphology and water distribution, as illustrated by conventional and spreadable butter in Figures 1A and 1B. Chemical maps can also distinguish lipid-rich and aqueous regions within modified dairy emulsions, such as butter containing rapeseed oil in Figure 1C.
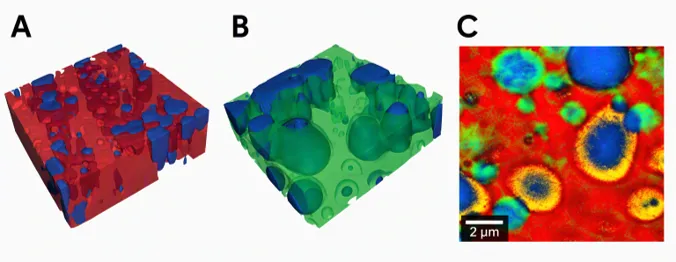
Figure 1. 3D confocal Raman imaging of conventional (A) and spreadable butter (B). Coloured Raman image of butter with rapeseed oil (C), blue: water phase; red, yellow, and green: fat phases.
MQC-R TD-NMR complements Raman imaging by analysing a larger bulk sample volume. Its dedicated Droplet Size Distribution application characterises the dispersed-phase droplet population through restricted diffusion measurements under pulsed field gradients. T1 and gradient filters suppress signals from the continuous phase—fat in margarine and water in mayonnaise—so that the measurement focuses on the dispersed phase. To simplify the workflow, the standalone MQC-R Droplet Size Distribution application incorporates these filters and pulse sequences into a script that guides the user through the measurement workflow with on-screen instructions.
Experimental Setup
Samples
Two commercial margarine and mayonnaise samples were analysed. The margarine contained rapeseed, palm and sunflower oils, water and emulsifiers, and was characterised as a water-in-oil emulsion. The mayonnaise contained rapeseed and sunflower oils, water and egg yolk, and was characterised as an oil-in-water emulsion. The two products therefore provided examples of emulsions with reversed dispersed and continuous phases.
MQC-R TD-NMR analysis
TD-NMR measurements were performed using an Oxford Instruments MQC-R system equipped with pulsed field gradient and liquid variable-temperature capabilities. Samples were analysed using a 10 mm probe with an approximate cylindrical measurement volume of 10 mm in diameter and 10 mm in height. Margarine was measured at 5 °C and mayonnaise at 20 °C.
Droplet size distributions were determined using the dedicated MQC-R Droplet Size Distribution application and associated processing software for water-in-oil and oil-in-water emulsions. The method measures the gradient-dependent attenuation resulting from restricted diffusion of the dispersed-phase liquid. The software reported the median radius R0, number-mean radius R00, volume-weighted mean radius R33, distribution width and percentage of droplets within defined size ranges. For comparison with the Raman results, the corresponding characteristic diameters were calculated as D = 2R.
Raman imaging
Margarine and mayonnaise samples were placed between two coverslips and analysed at room temperature using an Oxford Instruments witec360 Raman imaging system. It was equipped with an oil-immersion objective and a 532 nm excitation laser. Raman images were acquired over an area of 30 µm x 30 µm with 90 x 90 pixels, and chemically distinct domains were identified from their Raman spectra.
The droplet analysis was carried out using ParticleScout. The dispersed droplets identified from the Raman images were segmented, and the two-dimensional convex area, A, of each droplet was measured. Each area was converted to an equivalent circular diameter using  The number-mean equivalent circular diameter was calculated as
 where ni is the number of droplets with equivalent circular diameter Di. Raman imaging therefore provided local, image-derived droplet sizes together with chemically resolved spatial information from the same selected region.
Do Raman and TD-NMR Identify Comparable Droplet Sizes?
Raman images
The Raman images in Figure 2 reveal the local droplet structures of margarine and mayonnaise, with finer droplets in margarine and larger droplets in mayonnaise. As Raman imaging examines selected microscopic areas, these images provide local spatial information rather than a bulk representation of the entire droplet population.
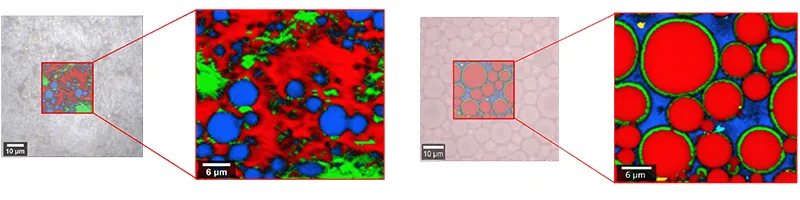
Figure 2. Raman optical images of margarine (on the left) and mayonnaise (on the right).
TD-NMR droplet size distributions
TD-NMR provided the corresponding bulk droplet size distributions across a larger sample volume (Figure 3). The distributions support the trend observed by Raman imaging: 66% of the margarine droplets were in the 1–2 µm range, whereas 64% of the mayonnaise droplets were in the 2–5 µm range. The TD-NMR results therefore indicate that the mayonnaise contained a greater proportion of larger droplets.
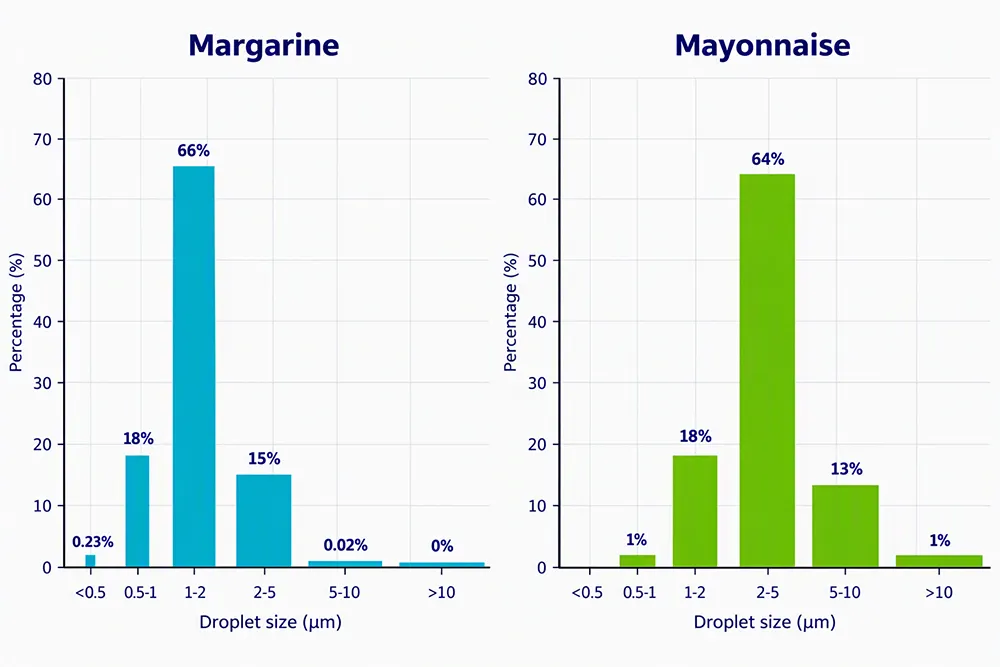
Figure 3. Droplet size distributions measured by MQC-R TD-NMR for margarine and mayonnaise
Both techniques therefore show the same overall droplet-size trend, despite their different sampling scales. The characteristic diameters obtained by each technique were subsequently compared quantitatively.
Droplet size quantitative comparison
With both techniques the characteristic diameters were measured and compared quantitatively in Table 1. For margarine, the droplet number-mean diameter D00 showed close agreement, with values of 1.98 µm by TD-NMR and 2.01 µm by Raman. The measured droplet size for mayonnaise differed slightly between the two techniques with D00 values of 3.20 µm by TD-NMR and 4.22 µm by Raman imaging. Both techniques identified larger characteristic droplet diameters in mayonnaise than in margarine.
Table 1. Characteristic droplet diameters by TD-NMR and Raman.
| Sample | Emulsion type | Raman D00 | TD-NMR D00 | TD-NMR D33 |
| Margarine | Water-in-oil | 2.01 µm | 1.98 µm | 2.93 µm |
| Mayonnaise | Oil-in-water | 4.22 µm | 3.20 µm | 6.72 µm |
D33, the volume-weighted mean droplet diameter, was calculated using TD-NMR. In the calculation of D33, droplets are weighted according to their volume, making this parameter particularly sensitive to larger droplets. It is therefore widely used in the food industry to detect formulation- or processing-related changes in an emulsion. D33 was not calculated from the Raman images because the relatively small field of view may cause the volume-weighted mean to be disproportionately influenced by a few larger droplets. In contrast, TD-NMR measures restricted diffusion across the bulk droplet population, providing a representative estimate of D33. The TD-NMR results (Table 1) are consistent with values reported in the literature [1,2].
What Additional Information does Raman Provide for Food Emulsions?
Beyond droplet size measurement, Raman imaging reveals the chemical organisation of the emulsions. Figure 4 shows distinct lipid, aqueous and interfacial domains. In margarine, water droplets and glyceride-rich crystalline regions are distributed within the continuous rapeseed oil phase. In mayonnaise, oil-rich droplets are surrounded by chemically distinct interfacial regions existing of glycoproteins which acts as emulsifier embedded in a water-saccharide phase. Raman spectra provide detailed molecular information on lipid structure and composition, including the degree of unsaturation, connecting chemical composition with the observed microstructure.
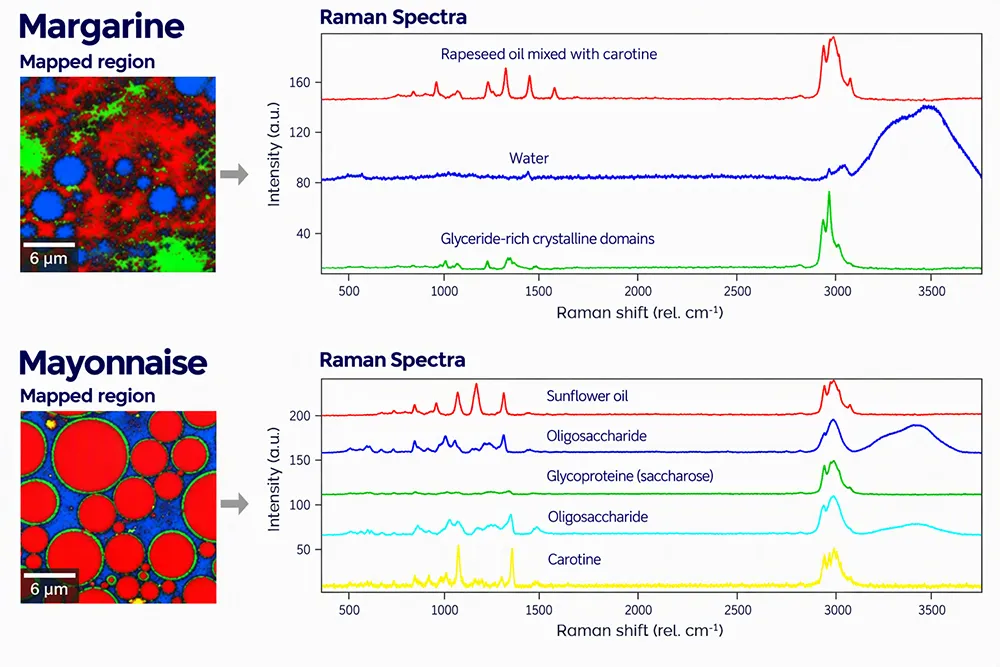
Figure 4. Raman spectra and maps for margarine (on top) and mayonnaise (on bottom).
Conclusion
This study demonstrated that TD-NMR and Raman imaging identified comparable differences in characteristic droplet size between margarine and mayonnaise. Their complementary measurements also provided information beyond droplet size alone, linking bulk emulsion behaviour with local structural and chemical composition.
Which Technique Should You Use – Raman or TD-NMR?
Use MQC-R TD-NMR to obtain representative bulk droplet size distributions, compare formulations or processing conditions, and monitor parameters such as D00 and D33. Use witec360 Raman imaging to visualise local microstructure, identify chemically distinct components, and determine their spatial distribution. Combine both techniques when the relationship between bulk droplet size behaviour and local chemical organisation needs to be understood. Table 2 summarises their respective capabilities and sampling considerations.
Table 2. Selection guide for TD-NMR and Raman imaging in food-emulsion analysis.
| Analytical aspect | MQC-R TD-NMR | Raman imaging |
| Measurement scale | Larger bulk sample volume | Selected microscopic area |
| Measurement principle | Restricted diffusion of the dispersed-phase liquid under pulsed field gradients | Chemical imaging based on Raman spectra |
| Droplet size result | Bulk distribution and characteristic size parameters across the 2–30 µm droplet size range | Equivalent diameters calculated from individually segmented droplets |
| Chemical and spatial information | Does not directly image or chemically identify individual domains | Maps chemically distinct droplets, phases and local structures |
| Sampling consideration | Representative of the bulk sample in three dimensions | Representative of the selected microscopic area |
References
1. Mishra P, van Dijk M, Wintermeyer C, Sabater C, Bot A, Verkleij T, Broeze J. At-line and inline prediction of droplet size in mayonnaise with near-infrared spectroscopy. Infrared Physics & Technology. 2022;123:104155. DOI: 10.1016/j.infrared.2022.104155.
2. van den Enden JC, Waddington D, van Aalst H, van Kralingen CG, Packer KJ. Rapid determination of water droplet size distributions by PFG-NMR. Journal of Colloid and Interface Science. 1990;140(1):105–113. DOI: 10.1016/0021-9797(90)90327-K.