Introduction
Geological samples can be extremely challenging to analyse using EBSD, not only are they non-conductive, but many rocks contain a large number of phases, typically with low symmetry and often producing relatively weak diffraction patterns. The challenge is twofold: firstly the EBSD detector needs to be sensitive enough to acquire good, high resolution EBSPs in a short time period, and secondly the software needs to be able to distinguish reliably between all the minerals present in the sample.
In this application we demonstrate the power of the Symmetry® CMOS-based detector coupled with the AZtec® software for the successful analysis of a multiphase, deformed eclogite sample. The extreme sensitivity of Symmetry enables high quality diffraction patterns to be collected in just a few milliseconds, and the advanced indexing algorithms within AZtec, as well as the full integration of EDS data, ensure reliable and accurate measurement of all phases.
Sample and Experimental Details
The sample is a high pressure rock sample, an eclogite, collected from the South Island of New Zealand. The mineralogy of the sample is relatively complex, with at least 10 phases present including garnet, omphacite, K-feldspar, plagioclase feldspar and quartz. Additional accessory phases include rutile, ilmenite, hornblende, apatite and kyanite. These phases represent a wide range of crystallographic symmetries, covering 6 of the 7 possible crystal systems.
The sample was polished down to a final stage using 50 nm colloidal silica suspension, and then coated with ~5 nm carbon prior to analysis to prevent charging. A field emission gun SEM was used for the EBSD analysis, using a 15 nA current at 20 kV accelerating voltage, scanning a 1000 x 1000 pixel grid on the sample surface with a measurement step size of 1.5 μm. EBSD patterns were collected using the Symmetry detector at a 312 x 256 pixel resolution and with an exposure time of 4 ms. Simultaneous X-ray measurements were collected using an X-Max® 80 EDS detector, and data were acquired using AZtec for all 10 phases. X-ray results aided the discrimination between the 2 feldspar phases, using the TruPhase option within AZtec. The hit rate was 96% at a speed of 247 indexed patterns per second, and minor data cleaning was performed to remove isolated non-indexed and misindexed pixels. The full data collection took 1 hour and 7 minutes.
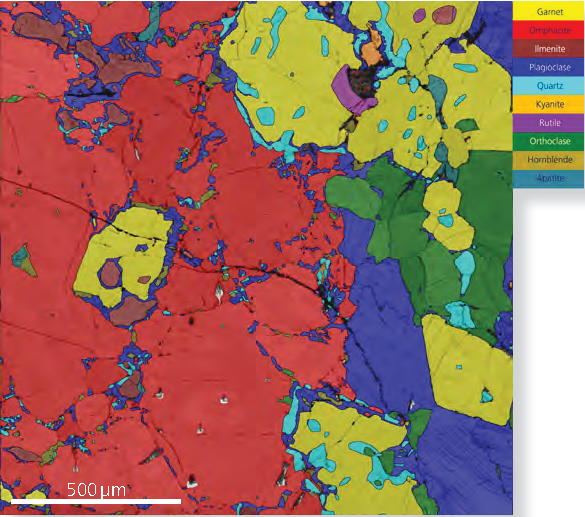 Fig. 1 — Phase map, superimposed on a pattern quality map.
Results
The phase map is shown in Fig. 1: the area is dominated by omphacite and garnet, with many small inclusions of quartz and accessory minerals. The two feldspars cover a large part to the right of the area, with plagioclase also forming small grains within the omphacite region. These are found lying along channels with higher Ca and Mg levels, as shown in the X-ray map in Fig. 2.
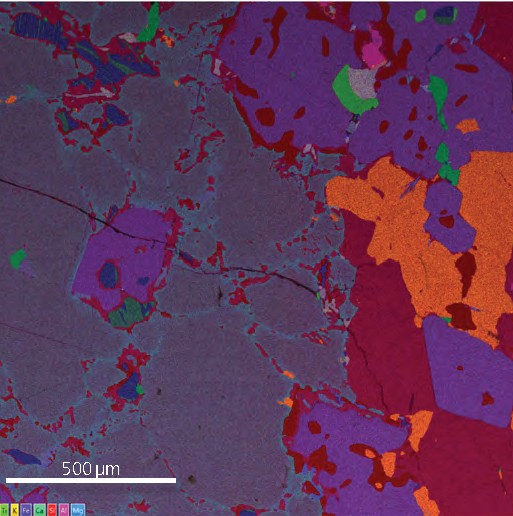 Fig. 2 — Mixed element X-ray map.
The orientation map (Fig. 3a) illustrates the coarse grained nature of the major phases, but shows little evidence for any preferred orientation. Twinning is seen within the plagioclase feldspar and the quartz grains, and evidence for plastic deformation within the omphacite grains is shown by the transect in Fig. 3b. Over 7° change in orientation within a single omphacite grain is observed: the high angular accuracy of this dataset allows very small orientation changes (<0.5°) to be reliably picked out.
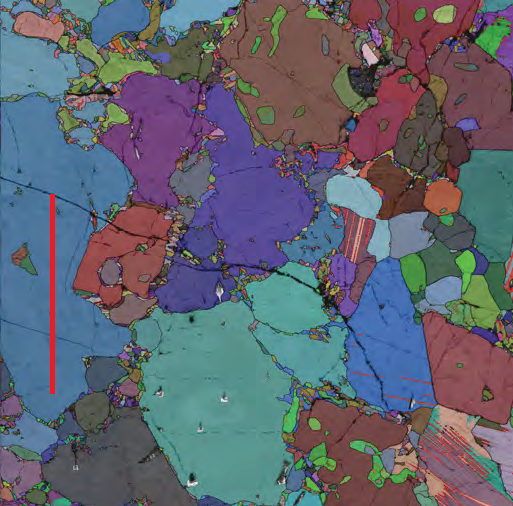 Fig. 3a — Orientation map (all Euler colouring scheme), superimposed on a pattern quality map. Red lines mark twin boundaries in the plagioclase and quartz. Thick red line marks a misorientation profile shown right.
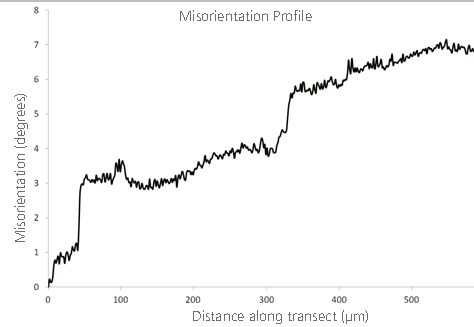 Fig. 3b — Relative misorientation profile along the transect shown in (a) within an omphacite grain.
Conclusion
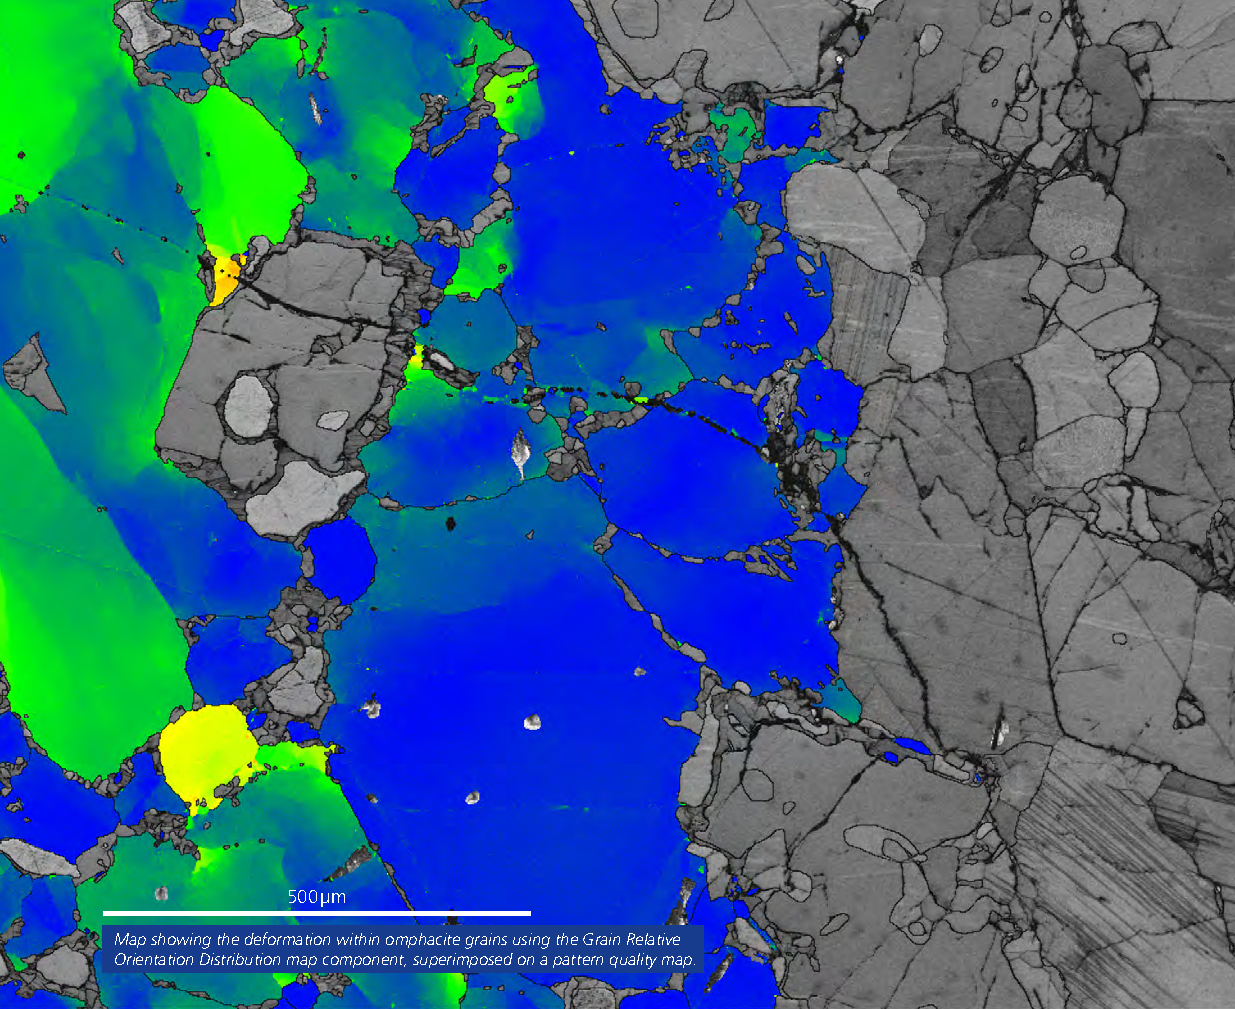 Map showing the deformation within omphacite grains using the Grain Relative Orientation Distribution map component, superimposed on a pattern quality map.
Symmetry, with its balance of speed and sensitivity, is the ideal detector for analysing complex geological samples. In this example, an area of an eclogite sample has been effectively analysed in just over 1 hour, with excellent measurement of all 10 phases, as well as simultaneous characterisation of the chemistry via EDS. These results allow researchers to understand in unprecedented detail the metamorphic and structural evolution of the suite of rocks from which this sample was collected.
Acknowledgements
Dr. Sandra Piazolo is thanked for providing the eclogite sample.

