Introduction
Photovoltaic (PV) cells are an attractive option for generating low carbon renewable energy but traditional designs often include undesirable toxic compounds and must be manufactured under special conditions. The all-oxide approach to photovoltaic cells is thus very attractive as it circumvents many of these issues and offers a potential method of creating a lower cost, more widely used product. AZtec LayerProbe was used to characterise a combinatorial library sample with varying layer thicknesses and compositions in order to determine which combination is most effective [1].
Composition and Thickness Measurements with AZtec LayerProbe
AZtec LayerProbe measures layer thicknesses and compositions by fitting a user defined model of the sample to an EDS spectrum obtained using the software. As the thickness and composition is calculated from an EDS spectrum acquired from the sample surface, LayerProbe is inherently non-destructive. This enables subsequent testing and analysis of the sample, in this case, allowing the electrical performance to be correlated with layer properties. LayerProbe's high spatial resolution permits analysis of features down to 200 nm wide with thicknesses between 2 nm and 2000 nm. LayerProbe suggests the optimum SEM conditions for a given analysis so that the highest quality results may be achieved.
Analysis of an All-Oxide Solar Cell Combinatorial Library
The sample investigated here consisted of a glass substrate, a transparent conductive oxide (TCO) layer (Fluorine doped SnO2), and as the active layers, a TiO2 layer with a constant thickness gradient and a top layer with varying CuxNiyOz composition and thickness. As such, the complete structure formed a combinatorial library of PV devices each with a unique combination of active layer composition and layer thickness.
In order to characterise layers in the sample, 208 EDS spectra were acquired from the top of the sample over an area of 42 x 36 mm. LayerProbe was then used to process the spectra. The starting model comprised of the layer sequence in the sample and the composition of all layers bar the CuxNiyOz. The parameters which were determined by LayerProbe were the thicknesses of the TCO and TiO2 layers, and both the thickness and composition of the top CuxNiyOz layer.
The surface plots show the results of the LayerProbe measurements. The thickness of the TCO layer was constant across the measured area, whereas that of the TiO2 layer varies linearly along the horizontal axis. The thickness of the CuxNiyOz layer has a more complex profile which corresponds to the shading which can be seen in the photograph of the sample.
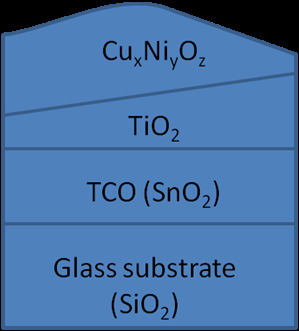
The layer structure of the all-oxide solar cell stack.
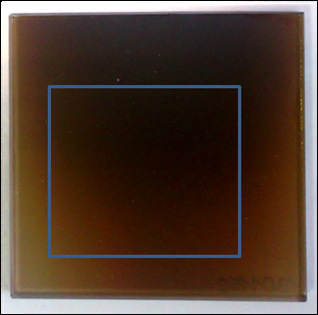
Photograph of the sample with the analysed area indicated by the rectangle.
Analysis of an All-Oxide Solar Cell Combinatorial Library
The sample investigated here consisted of a glass substrate, a transparent conductive oxide (TCO) layer (Fluorine doped SnO2 ), and as the active layers, a TiO2 layer with a constant thickness gradient and a top layer with varying Cux Niy Oz composition and thickness. As such, the complete structure formed a combinatorial library of PV devices each with a unique combination of active layer composition and layer thickness.
In order to characterise layers in the sample, 208 EDS spectra were acquired from the top of the sample over an area of 42 x 36 mm. LayerProbe was then used to process the spectra. The starting model comprised of the layer sequence in the sample and the composition of all layers bar the Cux Niy Oz . The parameters which were determined by LayerProbe were the thicknesses of the TCO and TiO2 layers, and both the thickness and composition of the top Cux Niy Oz layer.
The surface plots show the results of the LayerProbe measurements. The thickness of the TCO layer was constant across the measured area, whereas that of the TiO2 layer varies linearly along the horizontal axis. The thickness of the Cux Niy Oz layer has a more complex profile which corresponds to the shading which can be seen in the photograph of the sample.
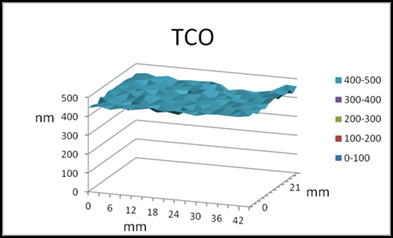
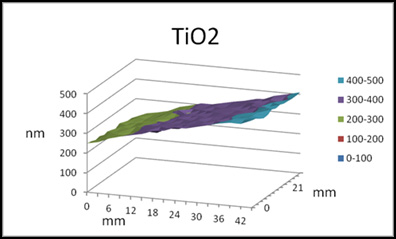
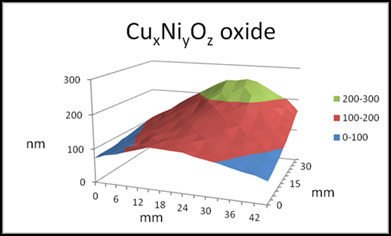
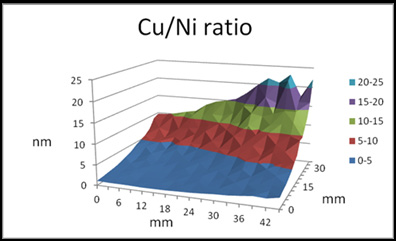
Surface plots show the layer thickness obtained using LayerProbe of the TCO layer, the TiO2 layer and the Cux Niy Oz layer respectively. The Cu/Ni ratio is that in the Cux Niy Oz layer.
Conclusion
The use of LayerProbe here has allowed the rapid and cost effective quantification of layer thickness and composition at 208 points in a non-destructive manner. As the combination of thickness and composition is different at each of these points, a large library of combinations has been analysed in a single sample. This data, combined with electro-optical characterisation of individual solar cell devices enables the rapid testing and development of new combinations of materials thereby bringing forward the release of increasingly economically viable devices.
References
- [1] S Rühle et al, J. Phys. Chem. Lett. 3 (2012) p. 3755.
This work was carried out in collaboration with S. Rühle, A. Y. Anderson and A. Zaban from the All-Oxide Photovoltaics Project, Bar Ilan Center for Nanotechnology and Advanced Materials, Bar Ilan University, Ramat Gan 52900, Israel.

