TruMap is a revolutionary way to collect and display mapping data with all the speed of traditional mapping and spectrum processing power of Tru-Q® in real time. TruMap displays the real variation of X-rays from the elements in the specimen; if you are used to using traditional digital mapping the results may surprise you.
Introduction
X-ray mapping has proved a powerful tool in the examination and interpretation of multi structural materials in the electron microscope. Simple digital mapping has been replaced by spectral mapping where spectral data is collected on a pixel by pixel basis and elemental spectra and quantitative maps can be constructed after the fact.
Digital maps are created by displaying the number of X-rays detected from a particular energy range at each pixel. However, as well as characteristic X-rays from a particular element, unwanted counts from overlapping elemental peaks or from the X-ray background can create misleading results.
The traditional solution to this has been to use quantitative mapping which processes the spectrum at each pixel to separate overlaps and remove background contribution. In some cases the data are processed further to determine the quantitative result at each pixel. Although this technique can produce excellent results, long data processing times and the large number of counts needed for successful data processing have limited its applicability.
With TruMap in AZtec, Oxford Instruments has developed an algorithm for peak deconvolution and background removal that is fast enough to work in real-time, calculating maps in seconds during or after acquisition. Using the Tru-Q data processing technology including FLS and QCAL, it also uniquely works on low and high count datasets without bias. This means a true picture of the elements in the sample is displayed with little or no trade-off in time or resolution.
Why is TruMap important?
TruMap gives the operator the ability to observe background-free maps in which elemental overlaps have been removed in real-time!
It is a perfect compliment for large area SDD detectors, such as Ultim Max, which can produce maps with more data than ever before. The maps being collected using SDD are bright and detailed, but much of the new data are actually not real and hinders understanding of the sample.
- Peak overlaps mean that element maps may in reality be showing the variation of other overlapped elements
- High count rate maps are sensitive enough to pick up X-ray variations due to changes in the X-ray background. Phases with heavier elements emit more X-rays than phases with lighter elements and some features in X-ray maps may appear real but are, in actual fact, artefacts
TruMap removes these artefacts to give the right — rather than the bright — picture of the sample.
Comparison of digital and TruMaps
To illustrate the power of TruMap, a refractory oxide containing slag sample from clean steel manufacture was studied. One interest in this sample was to study the take-up of minor elements during the slag formation (e.g. titanium and manganese).
A spectral map collected using AZtec SmartMap from the slag sample can be displayed using digital mapping or TruMap methods. Digital mapping of elements in the sample (Fig. 1) show the presence of significant amounts of manganese associated with chromium, and lower levels of titanium.
While the presence of these elements is expected in slag samples from the manufacture of clean steels, the high levels of manganese and the levels of titanium in some phases is not consistent with the raw materials used in this manufacturing process.
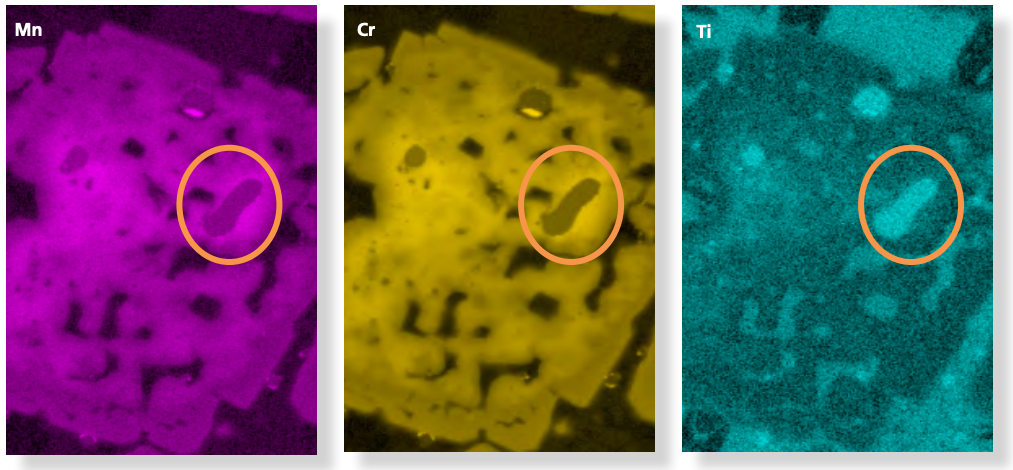
Fig. 1. Digital maps of manganese, chromium and titanium from the slag sample.
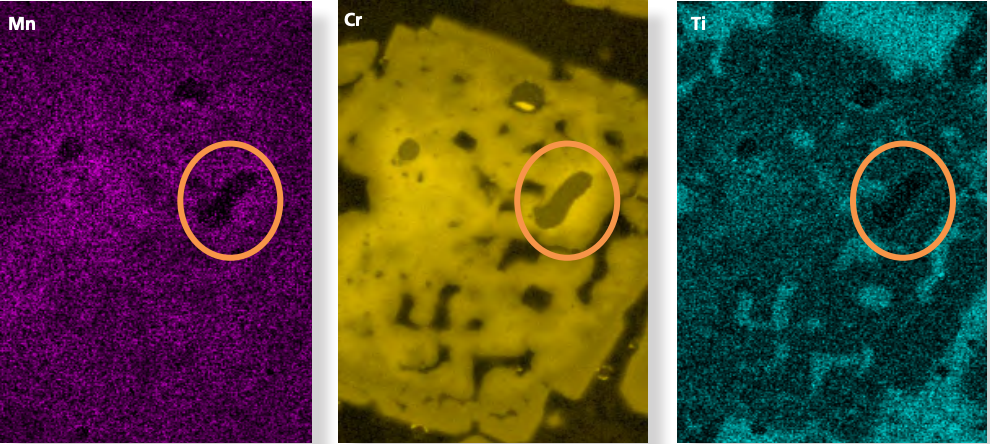
Fig. 2. TruMaps of manganese, chromium and titanium from the slag sample, showing accurate elemental distribution.
Why are TruMaps of manganese and titanium in the slag sample so different from the digital maps?
In the digital maps, why did manganese and chromium seem to be concentrated in the same phases when the TruMaps revealed that the manganese is present only as a minor element in some phases and absent from others?
The reason is that the digital maps did not show where elements are associated in the specimen, but where they are associated in the X-ray spectrum. Manganese Ka and chromium Kb lines lines overlap, and when the counts for the manganese energy window are counted by the software they will include both manganese and chromium (Fig. 3). AZtec software warns the user of these problems when showing digital maps using SmartMap, it is then a good time to recalculate the data using TruMap.
By using Tru-Q technology, TruMap separates out the overlaps and determines correctly which X-rays come from which element.
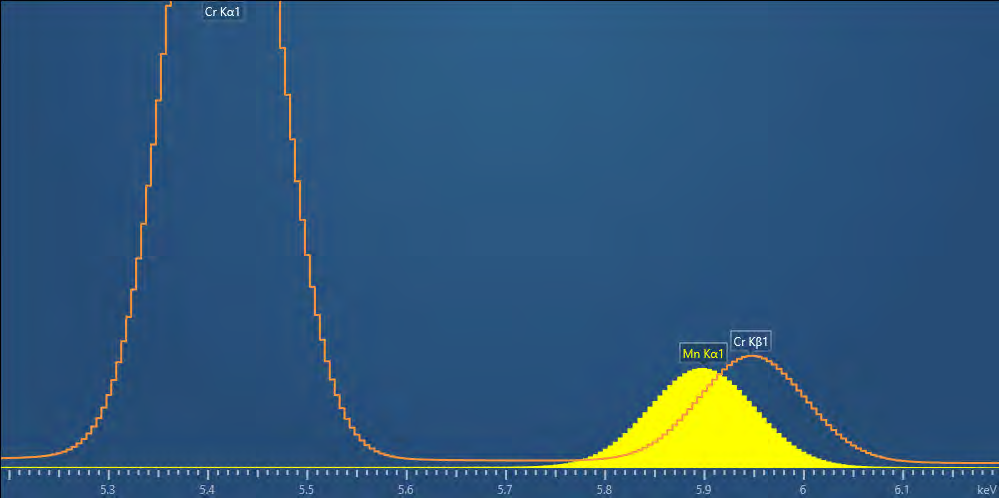
Fig. 3. Spectrum indicating the placement of the energy window used for the calculation of manganese digital maps. It can be seen that the manganese map will also include X-rays from the chromium from the spinel and Fe/Cr inclusions.
TruMap gives a real picture for elements where there are no overlaps
The titanium map in Fig. 1 suggested the highest concentrations of titanium were in inclusions, for example in the highlighted region. TruMap (Fig. 2) casts doubt on this finding, suggesting that titanium is absent from these inclusions. This example shows misleading results due to the addition of the signal from the varying X-ray backgrounds. The titanium map in Fig. 1 may look like it has more information than the titanium TruMap in Fig. 2, but that is because only the titanium TruMap is linked to the real information.
By reconstructing spectra from areas of different titanium composition and comparing the intensity of X-rays at the energy of the titanium K line we can see the reason for this anomaly (Fig. 4). The highest intensity of titanium comes from the highlighted Fe/Cr inclusion (Spectrum 1). Here, the intensity can be seen to be simply due to the higher background caused by higher X-ray emission from heavier iron-rich areas; there is no titanium in this phase. The other two spectra show phases with minor levels of titanium. However, even here the intensity of titanium in Cr-spinel (Spectrum 2) is slightly exaggerated compared to that in the Mg/Al silicate (Spectrum 3) due to the contribution of X-ray background being higher in the higher average atomic number Cr-spinel.
Therefore TruMap not only removes false data, but enhances sensitivity of extremely low count rate information, to extract the real variation of minor elements in a sample. With the enhanced sensitivity of large area Ultim Max detectors, the capability to map minor elements when TruMap is used is remarkable (Fig. 5). The level of manganese and titanium measured by Spectrum 2 are only 0.3 and 0.1 wt% respectively. Neither of these elements have been detected in the highlighted Fe/Cr inclusion.
One final feature of the TruMaps to note is that if the data is real it is not lost. Take for example the chromium TruMap in Fig. 2. The chromium Kα peak used in the digital X-ray map is not overlapped by other elements, and its intensity is much higher than the X-ray background. Therefore TruMap makes no obvious change to the displayed distribution of this element.
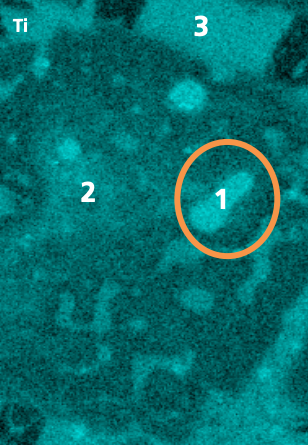
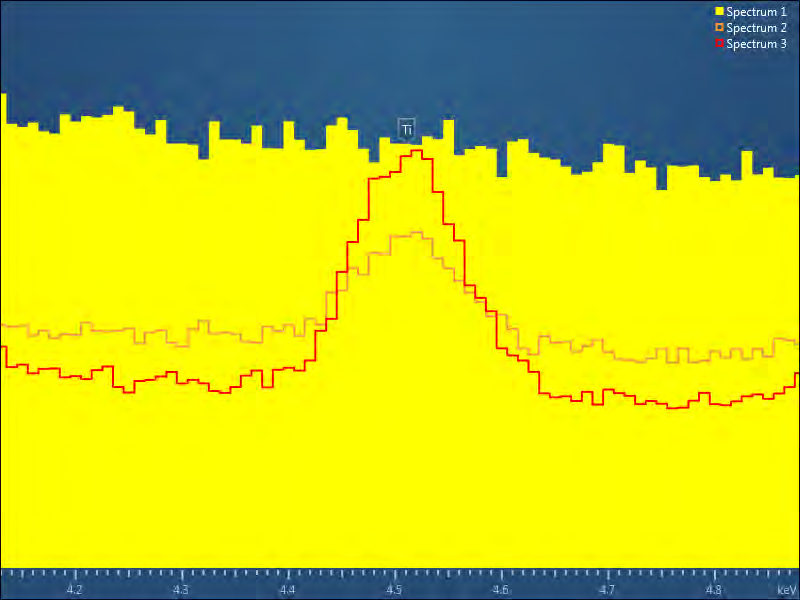
Fig. 4. Spectra collected from three areas of the slag sample. A) Areas of analysis shown on the titanium digital X-ray map. B) Spectra from 1) Fe/Cr particles, 2) Cr-spinel and 3) Mg/Al Silicate. The red window shows the energy range from which X-rays are included in the titanium digital X-ray map.
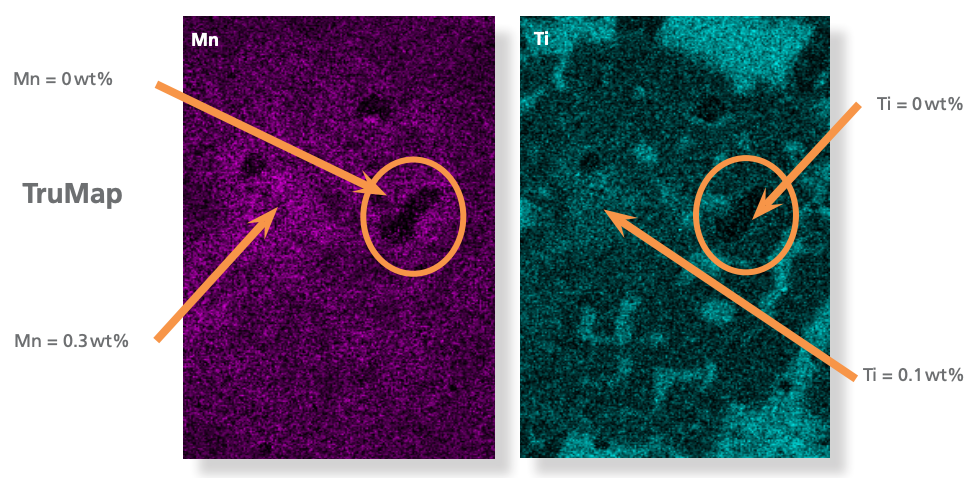
Fig. 5. TruMaps of manganese and titanium highlighting the very small changes in composition that are revealed. The difference between 0 and 0.3wt% manganese, and 0 and 0.1wt% titanium is clearly visible.
Summary
TruMap is a unique method of generating X-maps corrected for background and peak overlaps, in real-time and on any level of data. It removes false information from other elements, and from variations in the X-ray background. It also enhances real variations, often extremely subtle, that are hidden by these non-element variations. It therefore gives more real data, and is more sensitive than digital mapping, but with no time penalty. It also works on all count rates and levels of data: if you can see something in a digital map, provided it is real you will see it the same or better with a TruMap. Only with the accuracy and power of AZtec is this possible: once you have tried it you will never map any other way.

