Introduction
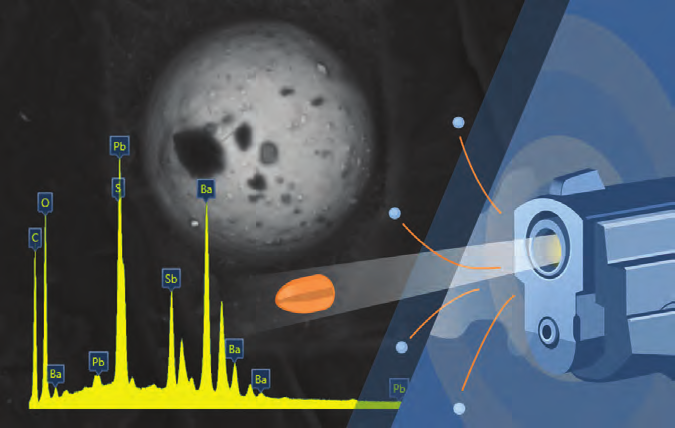
Gunshot residue (GSR) is produced from the condensation of the vapour cloud which is generated from the primer and propellant when a bullet is fired from a gun. The condensing vapour from the primer will form particles which are typically spherical and range from potentially less than 0.5 µm up to significantly larger sizes and of a characteristic composition depending on the type of ammunition. These particles may land on the hands and body of the shooter or other persons present when the gun was fired. By collecting and identifying these particles it is possible to associate a person with a crime scene where a gun was used.
SEM-based GSR Analysis
The scanning electron microscope (SEM) is a powerful tool for the imaging of small particles. By combining the SEM with an energy dispersive X-ray spectroscopy (EDS) system, chemical information can additionally be obtained. Here, we discuss the use of AZtecGSR, a dedicated implementation of the AZtecFeature particle analysis system, for the analysis of a GSR sample. We make use of large area X-MaxN silicon drift detectors (SDDs) which enable high resolution spectra to be acquired at high count rates. By working at high count rates less time can be spent analysing each individual particle whilst maintaining the statistical certainty of the analysis (by having the same number of counts in spectra). All data measured by the detector is processed with the AZtec Tru-Q™ algorithms which, by having the same number of counts in each spectrum, ensure that a quantification of the highest quality is achieved.
Sample Preparation
GSR samples are collected from suspects by pressing a stub with a carbon sticky pad against the skin and clothing. The samples require no additional preparation and can be placed directly into the SEM. See Fig. 1, which shows an example of a sample stub for GSR analysis.
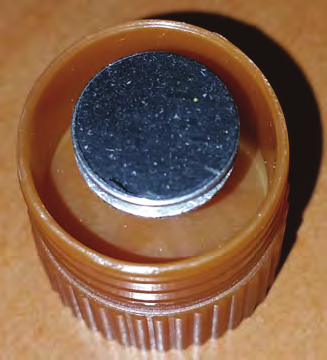
Fig. 1. Typical sample stub for GSR analysis.
Detecting GSR Particles
Sample stubs are imaged under the electron beam using the microscope's backscattered electron (BSE) detector. The BSE signal is used because the image contrast is dependent on the mean atomic mass of the elements within the particle being irradiated by the beam. As GSR particles are made of very dense elements (e.g. GSR particles generated from Pb bearing ammunition characteristically contain Pb, Ba and Sb) they will appear significantly brighter than other particles of different origins and the background mounting material. This means that we can identify where particles are situated on a stub by means of their grey level. Thresholds are set up which define a range of grey levels into which particles fall. A two-pass imaging technique is used to ensure that overall image acquisition speeds are high while also ensuring that analysis time is concentrated where particles are present. This approach is particularly effective for detecting and locating small particles and ensuring that EDS data is collected from the correct location. Particle morphology is measured from these images immediately and is combined with chemical data from the subsequent EDS analysis. Fig. 2 shows the result of the particle detection process and a field of view where a number of particles have been detected (shown in various colours).

Fig. 2. BSE Image showing particles on GSR stub. Particles meeting detection criteria are coloured
EDS Analysis
Once particles have been located, chemistry is measured on a particle by particle basis using one or more large area X-MaxN SDDs. The measurements from the detector(s) are characterised and quantified by the Tru-Q algorithms utilising Auto-ID to identify elements and correct for any peak overlaps, pulse pile up or background effects. Speed is enhanced at this stage via streamlined and optimised communications and by taking advantage of quad-core multi-threaded computing which enables high levels of multi-tasking. The run shown here was performed with an X-MaxN 150 mm² detector.
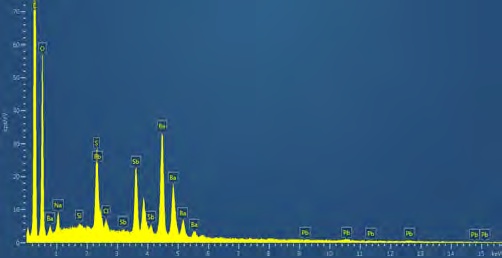
Fig. 3. Typical spectrum acquired from a Pb-bearing GSR particle. When large area SDDs are used, very short acquisition times can be used to maximise throughput.
Classification
As soon as EDS data is acquired, the quantified data is classified according to a choice of dedicated, in-built schemes which have been written to meet both ASTM E1588-16 and -17. These schemes include classifications for Pb-bearing and Pb-free ammunitions, and report results according to the recommended Characteristic/Consistent/Environmental nomenclature. Users can modify a copy of the schemes to, for example, add new ammunition types.
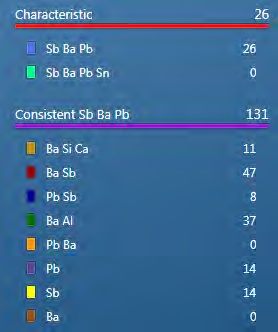
Fig. 4. Classification of particles from Pb-bearing ammunition found in GSR sample.
Validation and Repeatability
Repeatability between runs is ensured by performing an image calibration (with a supplied image calibration standard) during each analysis session. This calibration ensures that the correct microscope contrast/brightness are used each time and therefore that the same grey level thresholds can be used each time and that the same number of particles are detected. Validation routines are built into the software and include reports on the energy calibration of the detector, the beam current and the thresholding used.
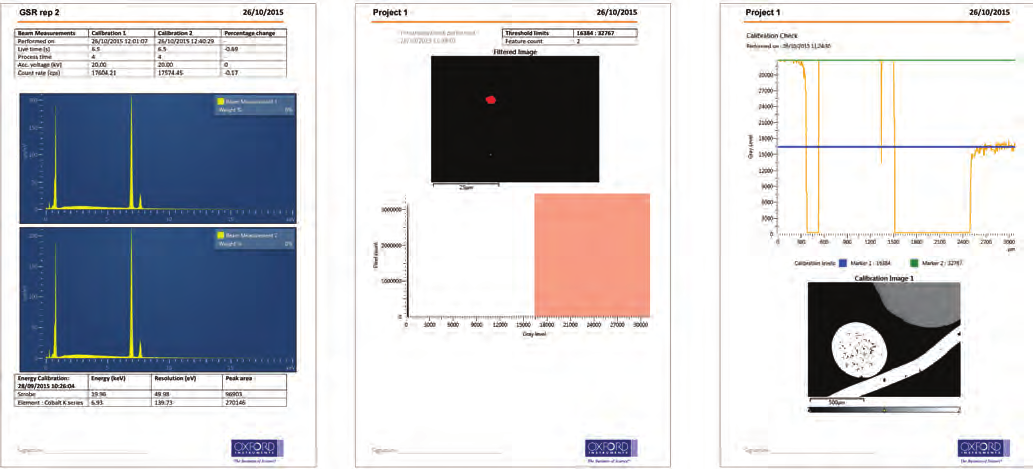
Fig. 5. Report Templates used in AZtecGSR to validate the system. From left to right: Beam current checks – pre and post run with comparison, Threshold checks – grey level thresholds are listed along with number of particles found in threshold, Image calibration check – contrast and brightness are set on a standard sample to specific values to ensure repeatability
Automated Large Area Runs
The user is able to confirm the settings to be used on a single field of view before they are applied to every field of a large area. As such, an entire stub can be analysed with the results from each field combined into a single data set. Multiple areas for large area analysis can be created, analysed and stored for future recall. The data shown in this application note was obtained from a large area run over a total area in excess of 120 mm² at a pixel resolution of 0.33 µm in a time of approximately 140 minutes.
Review and Reporting
Data can be reviewed while a run is in progress, taking advantage of real time analysis and classification. Particles of particular interest can be marked for further review or analysis. This feature is particularly useful as the ASTM standard stipulates that suspected GSR particles must be manually reviewed and confirmed by the operator. AZtecFeature simplifies this process by including automated reacquisition functionality which can re-visit particles, obtaining higher magnification/resolution images and longer duration spectra. Detailed batch reports can be generated from this data via a single click.
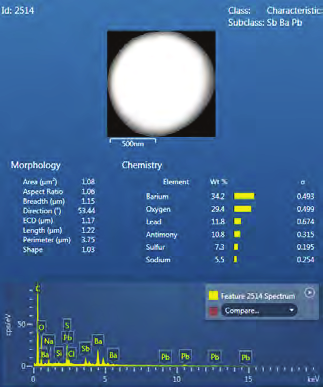
Fig. 6. Details of a single reacquired particle characteristic of GSR.
Ease of Use
Users are guided through the analysis process by "Step Notes" which detail the workflow to be followed. These can be customised according to specific user requirements. All image acquisition and EDS analysis settings are pre-set to optimised values. All settings are stored and recalled each time an analysis is performed. The interface is designed to be intuitive, guiding the user through the task of analysis. Ease of use enhancements ensure that setup time is reduced and that new operators can learn the system quickly.
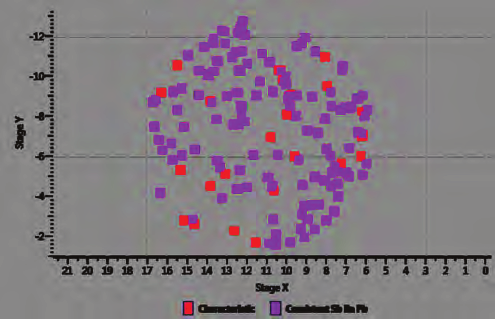
Fig. 7. Scatterplot showing distribution of particles characteristic and consistent with GSR.
Conclusion
Here we have shown that AZtecGSR is a powerful tool for the analysis of samples containing potential GSR particles. By utilising large area X-MaxN SDDs a high throughput can be achieved while, at the same time, obtaining fully quantified compositional data. The use of a dedicated classification scheme with pre-optimised settings ensures that data meets the chosen ASTM E1588 standard. Ease of use enhancements ensure that setup time is reduced and that new operators can learn the system quickly. Full validation routines provide evidence that the system meets the performance requirements set out in the standard. Dedicated reporting gives detailed results immediately after a run is completed.

