Introduction
The AutoPhaseMap module in the Oxford Instruments' EDS software, AZtecEnergy, automatically finds areas of different characteristic composition from X-ray map data, and determines the distribution, area, constituent elements and composition of each of these areas or phases. This application note examines how this technique can uncover previously missed minor phases — even when their constituent elements are not known to be present in advance.
AutoPhaseMap of an Igneous Rock Sample
Analysis is based on an X-ray SmartMap of resolution 1871 x 1234 collected over a region of the sample. A high pixel resolution was chosen for the map acquisition due to the very large range of grain sizes within the sample, which range from greater than 1 mm right down to close to 1 μm. The X-ray maps identified automatically by the software are shown in Fig. 1.
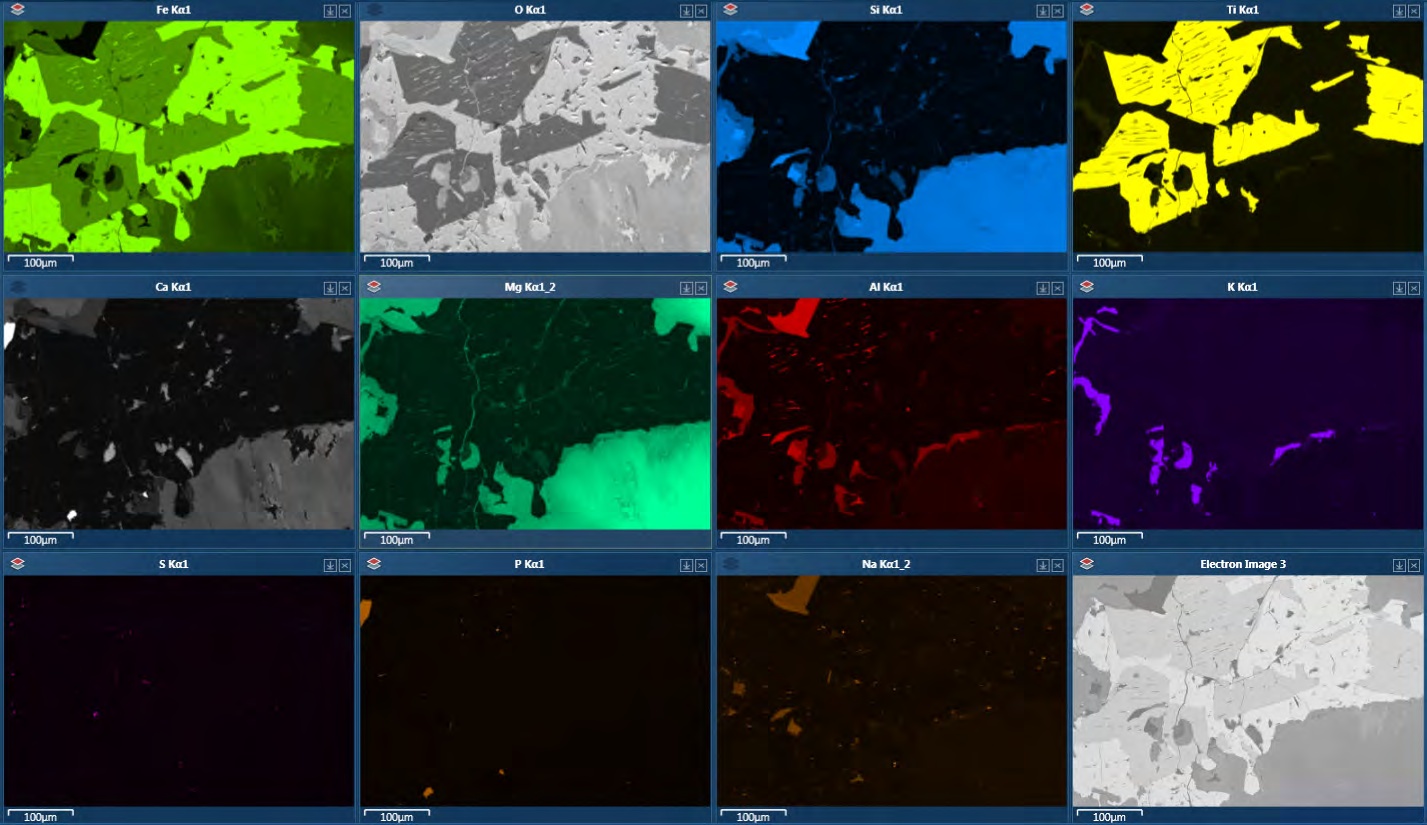
Fig. 1. X-ray maps displayed automatically by the AZtecEnergy software
From the X-ray maps, a Layered Image (Fig. 2a) was constructed, combining the information from eight of the element maps in different colours to summarise the chemical distributions present in the sample. An AutoPhaseMap (Fig. 2b) was also calculated from the data, to identify the phases present, their constituent elements, composition and area fraction.
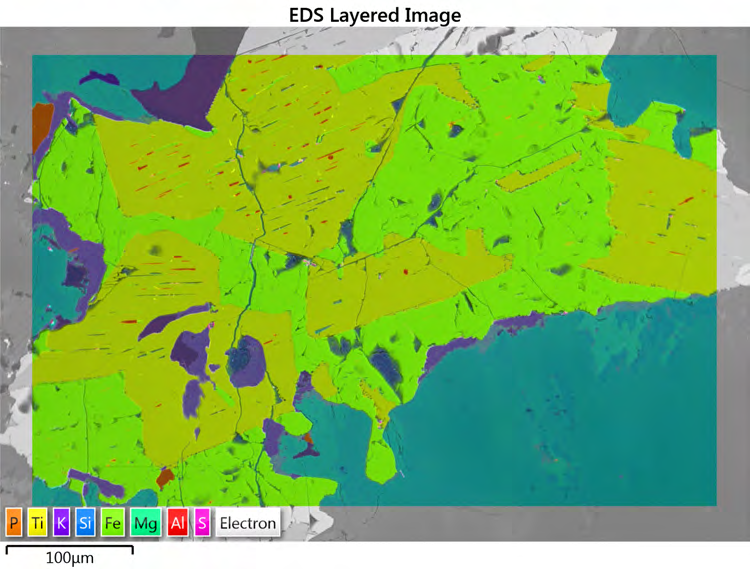
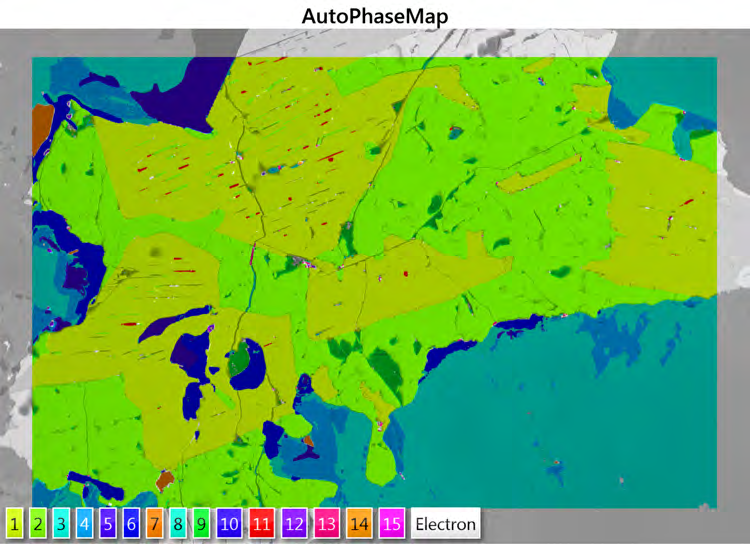
Fig. 2 AutoPhaseMap calculation for the sample converts X-ray mapping data summarised in (a) the Layered Image into (b) an AutoPhaseMap dataset where each pixel is designated as a phase. Note that the colours assigned to each phase match the hue in the Layered Image by default, therefore phases with similar chemistry have similar colours.
The 15 phases found and their area fractions are shown in Table 1. Close inspection of these results shows a number of minor phases, some with extremely low abundance, and highlights elements that were not identified in the X-ray map list.
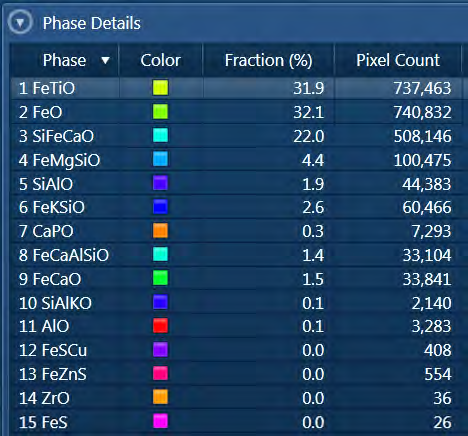
Table 1. Area fraction table for the phases identified by AutoPhaseMap. Note trace amounts of phases 12, 13, and 14 which contain elements Cu, Zn and Zr that were not present in the map set used for the AutoPhaseMap calculation.
Identification of Minor Phases
The phases identified by AutoPhaseMap included some unexpected minor phases with elements not previously identified in the sample, including copper (12 FeSCu), zinc (13 FeZnS) and zirconium (14 ZrO). The number of pixels identified for these phases are extremely small. For example, 14 ZrO has only 36 pixels (Table 1), which on investigation is shown to be 1 grain with a size of only 2 μm (Fig. 3). The spectrum from the phase (Fig. 4) has easily enough statistics to show that the mineral is ZrO2, or baddeleyite, which is relatively rare in igneous rocks. The other minerals are chalcopyrite, FeCuS2, and sphalerite, ZnFeS2.
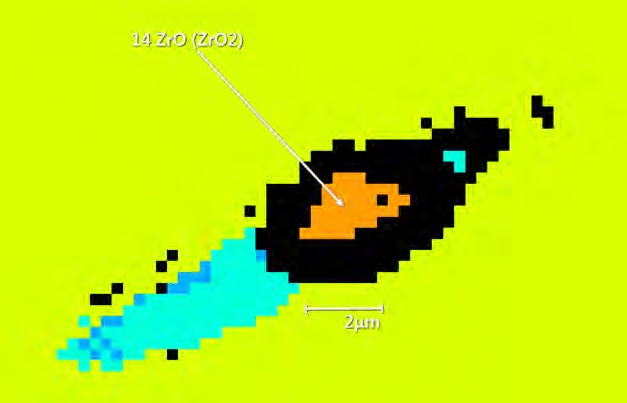
Fig. 3. AutoPhaseMap image zoomed to focus on a grain of ZrO2 or baddelyite (orange). The black area around the grain represents pixels that have been rejected because they contain signals from ZrO2 and surrounding ilmenite (light green).
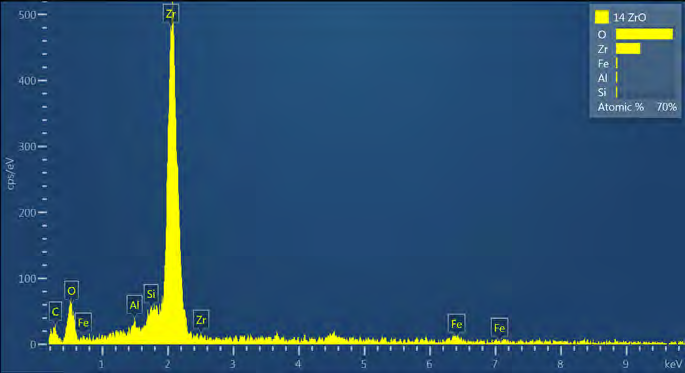
Fig. 4. Reconstructed spectrum and quantitative analysis from the 36 pixels that make up the ZrO2 phase. The spectrum contains almost no Ti and Fe X-rays from the surrounding ilmenite (FeTiO3 ), due to the rejection by the AutoPhaseMap algorithm, of pixels with mixed X-ray signals.
X-ray maps reconstructed for these elements and calculated as TruMaps (to remove the effects of overlaps and X-ray background) (Fig. 5), show that these elements are only present as very small grains, of similar size to the 2 μm baddeleyite grain.
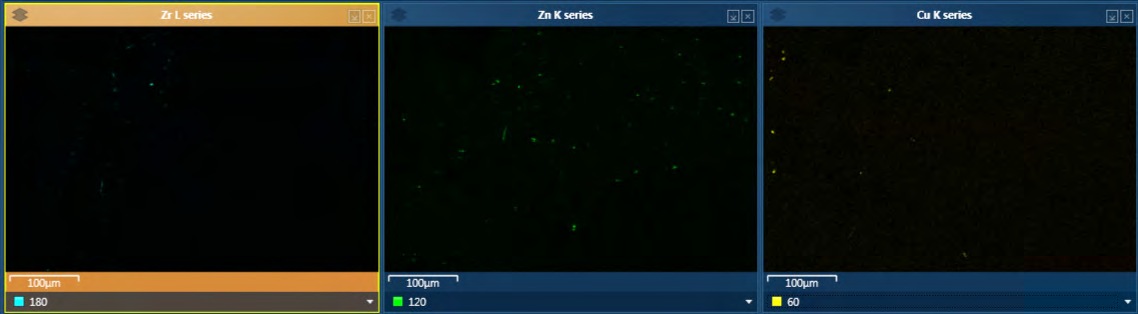
Fig. 5. X-ray TruMaps for zirconium, zinc and copper reconstructed from the SmartMap.
Conclusion
In addition to identifying the major phases in a sample, AutoPhaseMap can be used to reveal and study the phases in much greater detail. Its capability to analyse high image resolution data sets and its extremely high sensitivity means it can be used to identify phases present in very small concentrations and as very small particle sizes, even if constituent elements are previously unknown in the sample.

