Introduction: Automated workflow for correlative imaging of 2D materials
Characterising 2D materials like graphene, transition metal dichalcogenides (TMDs), and hexagonal boron nitride (hBN)
typically requires combining multiple optical techniques because each method reveals different physical properties.
Without an automated workflow, the user must manually switch between techniques and initiate each measurement.
This article presents a workflow that integrates Raman, photoluminescence (PL), and polarisation-resolved second
harmonic generation (SHG) imaging into one automated measurement routine. As all measurements are performed at the
same sample position, the resulting image set enables direct comparison of the complementary information provided by
the three techniques:
- Raman spectroscopy and imaging reveals crystal structure, layer number, strain, and defects.
- Photoluminescence provides information on the electronic structure, bandgap, and electronic
behaviour.
- Polarised Second Harmonic Generation is sensitive to symmetry, crystal orientation, and layer
stacking.
The automated workflow is particularly relevant for high-throughput characterisation, core facilities, and industrial
environments that require reproducible multimodal measurements.
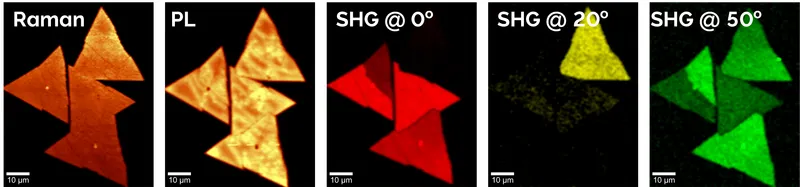
Fig. 1: Representative image examples of WS2 flakes obtained with the automated workflow. From left to
right: Raman image, PL image, and SHG images recorded at 0°, 20°, and 50° polarisation angle of the incoming laser
wave.
Benefits of an automated workflow for correlative optical characterisation
Compared to manual workflows, the automated approach reduces user intervention allowing for high throughput and
reproducibility in routine measurements (Table 1). Automation enables:
- Reduced time for measurements
- Consistent alignment across techniques
- Sequential acquisition without user intervention
- High spatial resolution
- Automated switching of spectrograph settings such as grating and centre of grating
- Automated laser switching
Table 1: Comparison of manual and automated workflow.
| Feature |
Manual Approach |
Automated Workflow |
| Setup per technique |
Required |
Single setup |
| Alignment |
Repeated |
Fixed and consistent |
| Measurement |
User intervention |
No user intervention |
| Throughput |
Low |
High |
| Reproducibility |
Variable results |
Assured consistent results |
Workflow implementation for automated Raman, PL and SHG imaging
The workflow consists of a one-time microscope setup (Fig. 2, bright blue steps) followed by a fully automated
acquisition sequence (Fig. 2, dark blue steps). Instead of starting each scan manually, the user defines the scan
area. Then the system executes all measurement modalities point by point and line by line and stores co-registered
datasets for direct comparison.
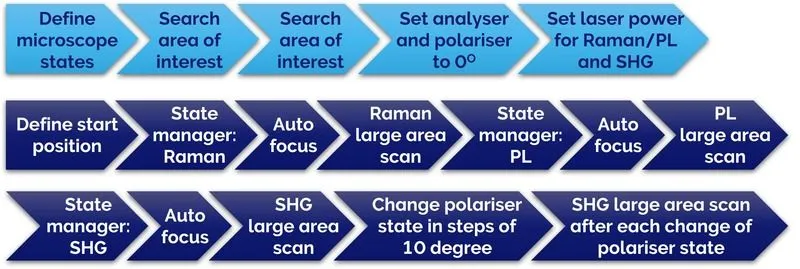
Fig. 2: Workflow for correlative Raman, PL and SHG imaging of 2D materials. Bright blue steps: Setting up the
witec360 microscope. Dark blue steps: Automated workflow.
Microscope configuration
The automated workflow and exemplary measurements presented in this article rely on a fully automated witec360
microscope with the following equipment configuration:
- HexaLight spectrograph with 150 g/mm and 1800 g/mm gratings
- Lasers:
- 532 nm for Raman and PL measurements
- 1064 nm pulsed laser for SHG measurements
- Objectives:
- 20x air objective for overview white light imaging
- 100x air objective for all other measurements
- Dual-pass polarisation configuration enabling continuous rotation of the incident laser polarisation from 0° to
360°, while maintaining a parallel orientation between the incident and detected polarisations
- Motorised sample stage
The acquisition sequence (dark blue steps of the workflow in Fig. 2) was automated using the Workflow Manager of the
WITec Suite software.
Using the automated workflow for multimodal characterisation of WS2 flakes
Tungsten disulfide (WS2) is a typical 2D semiconductor material used in optoelectronics and valleytronics.
WS2 flakes on Si/SiO2 substrates were characterised using the automated, multimodal microscopy
workflow integrating Raman, PL and polarised SHG imaging.
Fig. 3 shows the bright-field image of the area of interest. A common scan area was defined for Raman, PL and SHG
imaging, indicated by the red box in Fig. 3. All measurements were performed sequentially by the automated routine
without user intervention. High-resolution maps were acquired by raster scanning the sample with a fixed step size to
ensure dense spatial sampling. At each position, Raman spectra, PL emission, and SHG signals were recorded under their
respective excitation conditions while maintaining consistent spatial alignment. SHG images were acquired at seven
distinct incident-polarisation angles revealing the crystallographic orientation of the WS2 crystals. The
parameters for the automated scans are set in the Large Area Scan in the Control Window of the WITec Control software
and listed in Table 2.
The resulting datasets are intrinsically co-registered in the WITec Suite software and analysed to correlate
structural, optical, and symmetry-related properties across the sample.
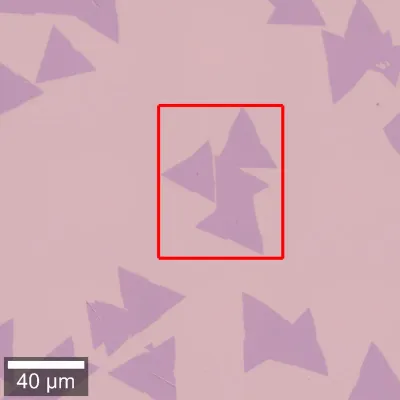
Fig. 3: Bright-field image of WS2 flakes, with the red box highlighting the area of interest for further
investigation by Raman, PL and SHG.
Table 2: Imaging parameters common to all measurements performed with this workflow.
| Imaging Parameter |
Objective |
Area |
Pixels |
Integration time per pixel |
|
100x/0.9 |
65 x 80 µm² |
130x160 |
0.05 s |
Correlative Raman, PL and SHG analysis of WS2 flakes
Figure 4 shows the nine co-registered Raman, PL and SHG datasets acquired automatically from the same sample region.
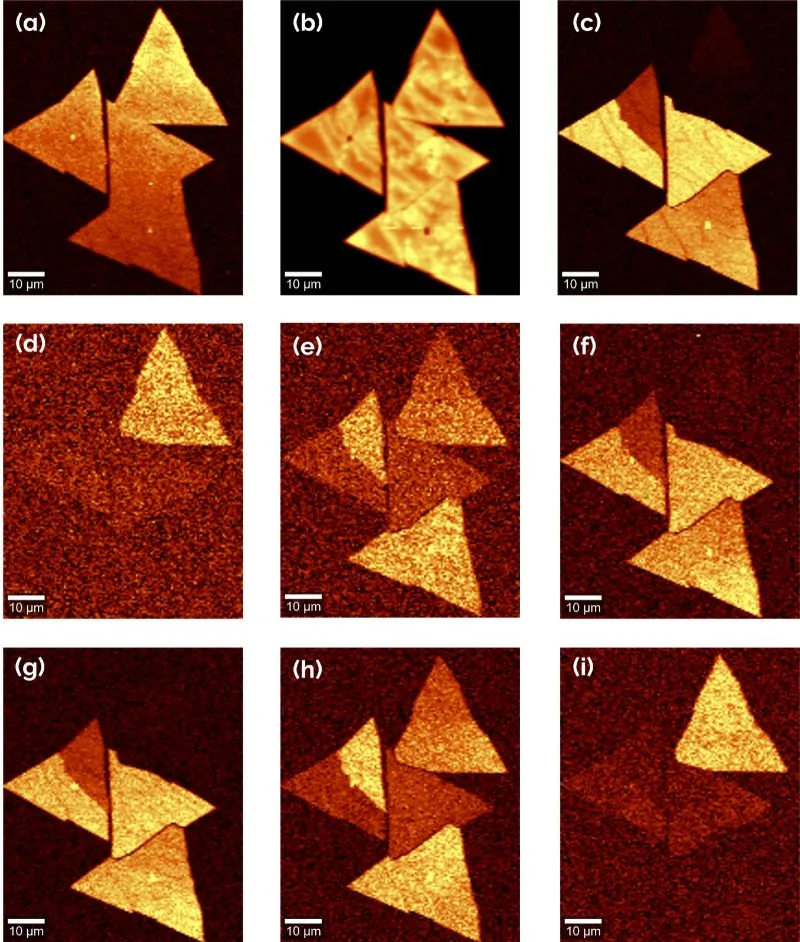
Fig. 4: Raman, PL and SHG image set of WS2 flakes acquired using the automated measurement workflow. (a)
Raman image, (b) PL image, and SHG images recorded at incident laser polarisation angles of (c) 0°, (d) 10°, (e) 20°,
(f) 30°, (g) 40°, (h) 50°, and (i) 60°. All images were generated using SUM filtering over the respective spectral
peaks.
The complementary information from the three techniques enables comprehensive characterisation of the WS2
sample.
Raman imaging: For 2D materials, Raman spectroscopy allows the identification of layer thickness
(intensity of Raman bands), strain or doping variations (via characteristic peak shifts), and confirms material
uniformity. In this case, the analysed WS2 crystals consist of uniform monolayers, without overlap (Fig.
4a).
PL imaging: Monolayer regions show strong PL emission. PL highlights defects or quenching regions
and can differentiate mono- and multilayer domains. In this case, the strong PL signal confirms the monolayer nature
of the crystals and highlights defects (Fig. 4b).
SHG imaging: SHG is sensitive to non-centrosymmetric structures. It provides strong signal in
odd-layer WS2 and reveals crystal orientation and domain boundaries (Fig. 4 c-i). To highlight the
sensitivity of SHG to crystal orientation, images were acquired at different polarisation directions of the incident
laser light.
Benefits of correlative Raman, PL and SHG imaging of 2D materials
Correlative Raman, PL and polarisation-resolved SHG imaging helps researchers comprehensively characterise 2D
material samples. By correlating the datasets:
- Layer identification becomes unambiguous
- Optical and structural properties can be cross-validated
- Defects or heterogeneities are better understood
- Complementary information on orientation and symmetry, layer thickness, strain, doping, and defects is revealed.
Typical applications of automated correlative workflows
The presented automated workflow for 2D materials characterisation is especially useful for academic and industrial
users who need reproducible characterisation workflows for:
- High-throughput screening of 2D materials
- Device fabrication optimisation
- Studying spatial heterogeneity
- Research on new layered materials
Summary
The example demonstrates an efficient, automated multimodal imaging workflow for characterising 2D materials that:
- Eliminates repeated manual intervention
- Combines Raman, PL and polarised SHG into one routine
- Produces high-resolution, co-registered datasets
- Assures reproducibility and comparability
- Enables deeper insight into material properties

