Introduction
Recent developments in EBSD have enabled great improvements in indexing reliability and accuracy. However, some phases continue to pose considerable indexing challenges, especially those that generate similar Kikuchi patterns for different crystallographic orientations. In this case the indexing algorithm may not clearly discern the correct orientation solution. This phenomenon is called "pseudo-symmetry". Typically in these cases only very slight differences in inter-band angle separate the possible solutions and only robust and accurate band detection may identify the correct one among them.
This application note describes an application of AZtec Refined Accuracy in solving pseudosymmetry problems in γ-TiAl.
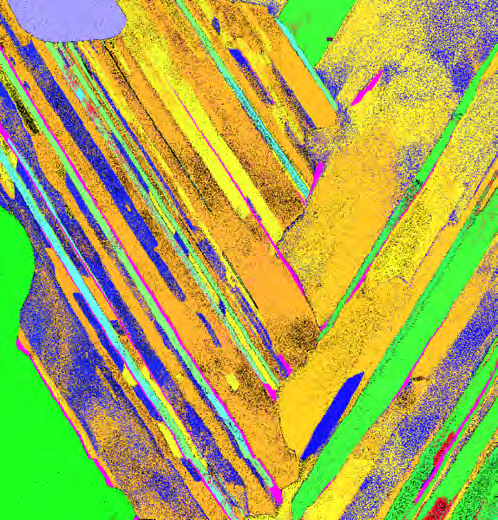
Before
After
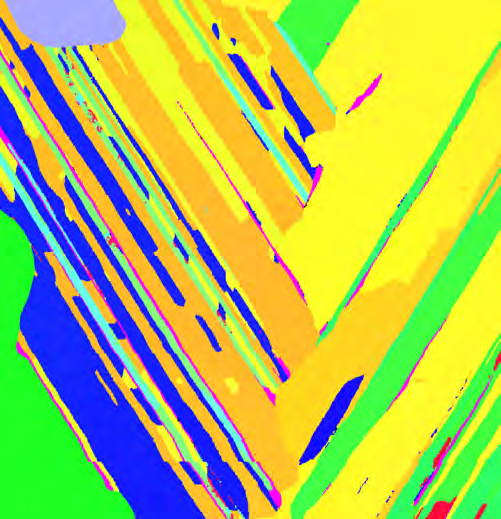
Analysis of g-TiAl before and after pseudo-symmetric processing. The ‘before’ shows a speckling effect which is typical when using traditional approaches, and is completely removed by pseudo-symmetric processing.
AZtec Refined Accuracy
Refined Accuracy (patent pending) is a new band detection refinement method which improves EBSD indexing performance for the most important and challenging cases, while maintaining reasonable data acquisition speeds. This method delivers higher accuracy band detection by iteratively comparing the positions of simulated bands with bands in the actual Kikuchi pattern image, using expected versus actual band widths and, importantly, accounting for the hyperbolic shape of bands on the phosphor screen (Fig. 1). In addition to delivering higher precision crystallographic orientation information and helping to discriminate different phases with similar Kikuchi patterns, this method is sufficiently sensitive to resolve fine differences in inter-band angle to nearly eliminate many cases of pseudo-symmetric mis-indexing. For especially difficult cases, known single-phase pseudo-symmetric orientation relationships may be specifically examined by the system to help further resolve these indexing issues.
Refined Accuracy uses a three stage process to determine the identity of a detected Kikuchi band in terms of phase and reflector family, then to go beyond the Hough transform to improve the fit between the calculated and actual band by taking into account position, width and shape directly from the Kikuchi pattern image. These stages are:
- Primary band detection. This applies a specially modified high speed, low resolution 2-D Hough to detect a set of Kikuchi bands (an approximate ρ, φ determined; see Fig. 1).
- Indexing. The detected Kikuchi bands are converted to 3D plane normals through the use of the pattern centre and the detector distance. The inter-planar angles between the 3D plane normals are compared to a list of possible inter-planar angles calculated from crystal structure information. This matching forms the basis for the crystallographic indexing of the Kikuchi bands. For each indexed Kikuchi band the theoretical Bragg angle is determined.
- Secondary band refinement. Given the Bragg angle, the expected hyperbolic shape of the band is simulated and a relatively fast optimisation is performed, constrained to (ρ, φ) only. The simulated band is fit as precisely as possible to the real, recorded band in the high-resolution Kikuchi pattern image space rather than Hough space, delivering the exact ρ and φ and returning the lowest fit residual for the correct original phase and orientation solution.
The improved accuracy of band detection delivered by this method brings three primary advantages over conventional, Hough-based methods:
- Discrimination of fine inter-planar angle differences, critical in applications when determining the correct solution among pseudo-symmetrically related candidate orientation solutions.
- More precise overall orientation determination, especially important in resolving subtle intra-grain lattice rotations due to strain.
- Improved phase discrimination, as Refined Accuracy can be applied during the original data collection, improvements are realized in real-time.
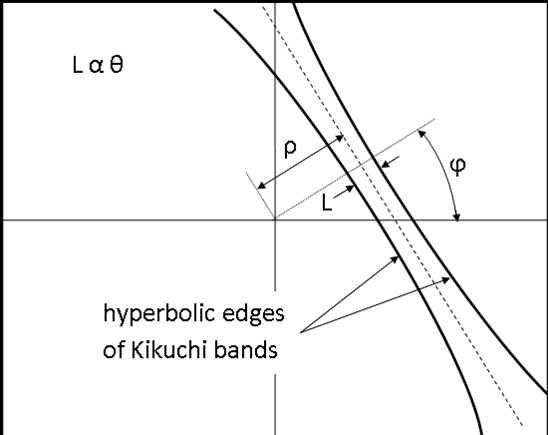
Fig. 1. Kikuchi band projected onto screen.
Example: γ-TiAl
Gamma titanium aluminides are very promising materials for aerospace applications due to increased performance-to-weight ratios and improved efficiency under aggressive environments at temperatures up to 750°C. Therefore, this material is projected to replace the heavier Ni-base superalloys, currently used for low pressure turbines (LPT) blade manufacturing.
However, the high temperature deformation behaviour of γ-TiAl needs to be better understood before it can widely replace the higher density Ni-base superalloys. In particular, a better understanding of the fundamentals of crystallographic activity with respect to the γ/γ lamellar variants could be critical. EBSD is potentially a useful tool in characterizing this material, however, pseudo-symmetry related mis-indexing is an issue.
Challenges in Analyzing γ-TiAl by EBSD
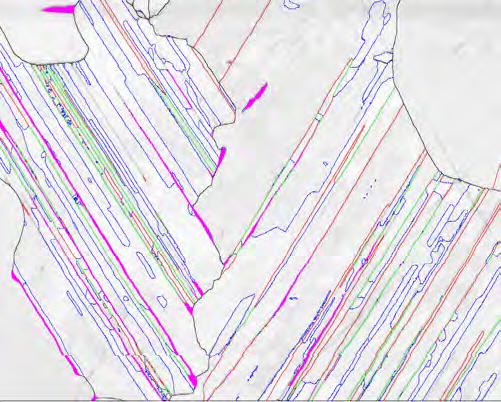
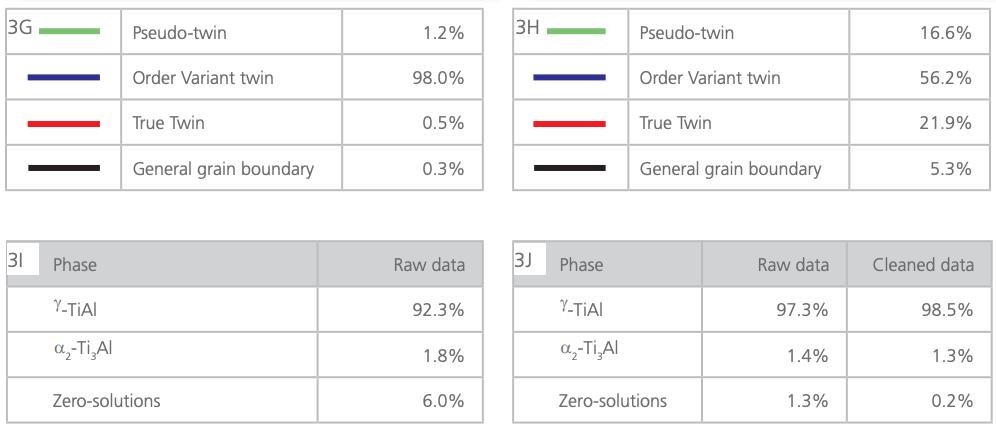
Pseudo-symmetric indexing problems in γ-TiAl arises from its close tetragonal c : a unit cell parameter ratio of 1.018, giving the generated Kikuchi patterns a pseudo-cubic configuration. This results in indexing inaccuracies, commonly with 90° orientation solution errors about the primary prismatic axes. These errors show the same mis-orientations as boundaries between real γ-TiAl lamellae, causing additional problems in revealing the true microstructure. Phase discrimination between coexisting γ(TiAl) and α₂(Ti₃Al) phases can also be difficult. There are three variants of γ/γ interfaces:
| Generated by | Minimum Rotation of |
| Pseudo-twin | 60° about <111>γ | 60° about <111>γ |
| Order Variant | 120° about <111>γ | 90° about <010>γ |
| True Twin | 180° about <111>γ | 70° about <110>γ |
Solving γ-TiAl with AZtec Refined Accuracy
The definition of the crystal structure including the <111> 3-fold pseudo-symmetry element, will ensure that AZtec generates the 3 pseudo-symmetry related solutions. Due to the application of Refined Accuracy, the band detection has a high accuracy, which in turn leads to low MAD (misfit) values. The solution with the lowest MAD value is chosen as the correct solution.
Below is a typical γ-TiAl pattern with the 3 pseudo-symmetry related solutions overlaid. The spread in MAD values is typical for this material and this pattern quality.
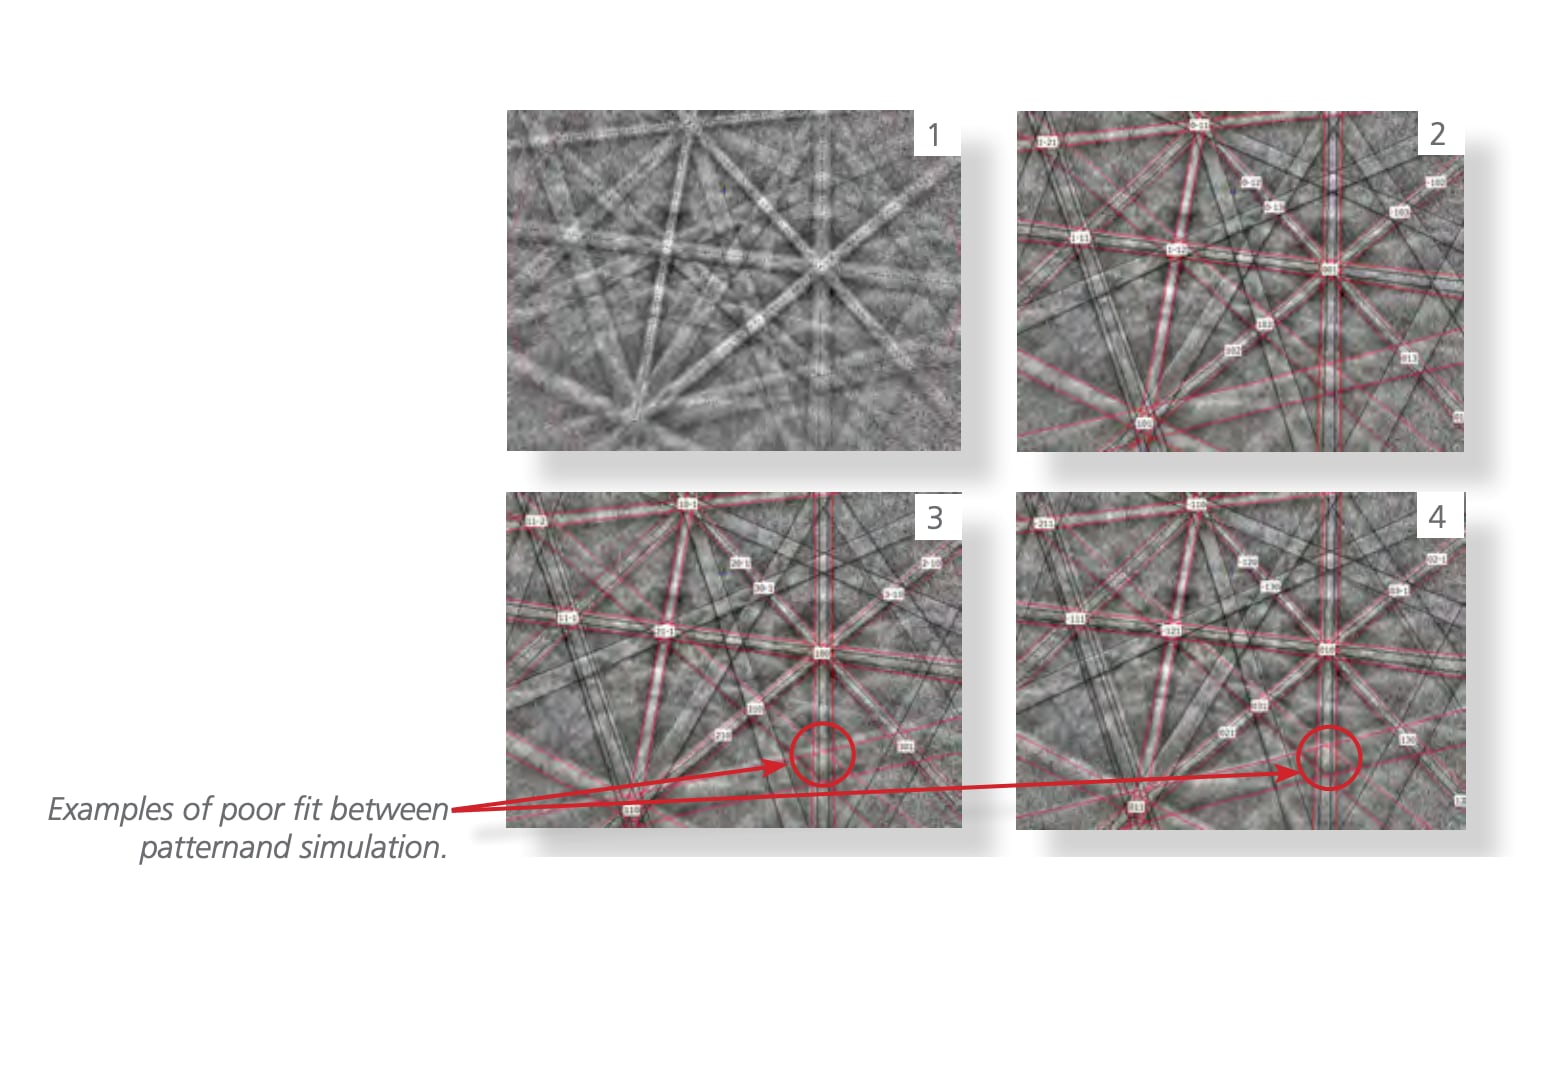
Fig. 2. 1. g-TiAl pattern with bands detected, 2. g-TiAl with correct solution, MAD=0.11°, 3. g-TiAl with incorrect solution, MAD = 0.47° 4. g-TiAl with incorrect solution, MAD = 0.53°
Results
A titanium-aluminide sample was analyzed with a FEG-SEM equipped with AZtec and a NordlysNano EBSD detector. EBSD data were taken at 20 kV at 4×4 binning (image resolution of 336×256 pixels), and no frame averaging. EBSD scanning was done at 50 nm step-size, and the dataset constitutes nearly 2 million data points.
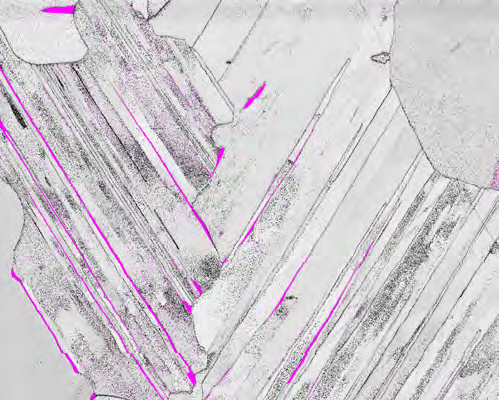
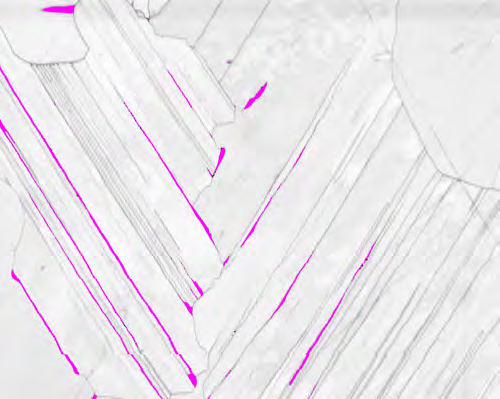
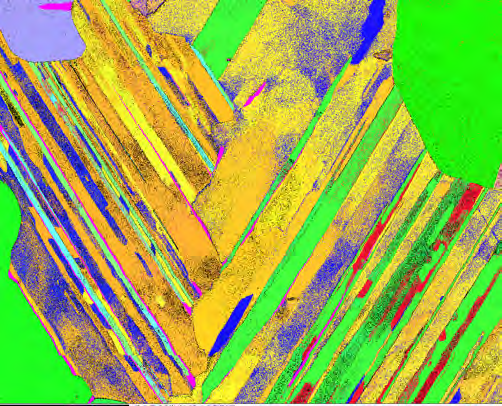
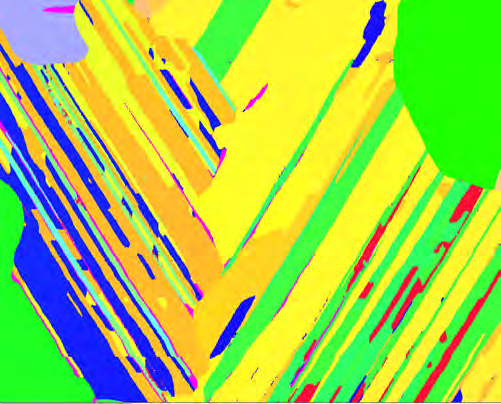
The dataset has been analyzed in two different ways. The first column represents a traditional Hough based band detection (Hough resolution of 50) and indexing. The second column shows the data when analyzed with Refined Accuracy and with the 3-fold pseudo symmetry defined around <111> for the γ-TiAl phase. For all maps, the minor phase α₂ (Ti₃Al) is shown in magenta, and constitutes 1–2% of the sample.
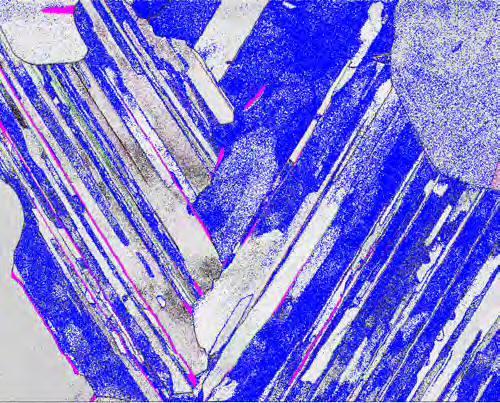
It is evident that there are significant problems in reliably resolving γ-TiAl to its pseudo-cubic tetragonal symmetry using the traditional approach. For that reason, no attempts were made to perform any cleanup of the data shown in the first column. In contrast, when analyzing with Refined Accuracy and the proper pseudo-symmetry definition, the raw data clearly shows the accurate lamellar structure. Still, it is estimated that 1–2% of the γ-TiAl measurements are characterized with pseudo-symmetric mis-indexing. Therefore, the maps in the second column have been through a slight data cleanup, consisting of a substitution of zero-solutions with nearby orientation measurements (noise reduction) followed by a grain detection where small grains (less than 10 pixels in size) were nullified and then processed with noise reduction.
The number of zero-solutions is around 6.0% with standard EBSD processing, whereas it is 1.3% when applying Refined Accuracy with the pseudo-symmetry definitions. The additional pseudo-symmetry element (3-fold <111> axis) clearly helps the indexing software to define and separate the pseudo-symmetry related solutions.
The effect of a more precise band detection with Refined Accuracy is shown in the two MAD distributions. For the traditional approach the average value is 0.4°, whereas this number is down to 0.2° for Refined Accuracy.
The grain boundaries for the γ-TiAl phase on a background of image quality (band contrast) clearly show the three types of twin boundaries, with their correct percentages listed below.
3A
3B
3C
3D
3E
3F
3A and 3B, Band contrast and α2 phase (magenta). 3C and 3D, IPF-z of the g phase and, in addition, the α2 phase (magenta). 3E and 3F, Band contrast with grain boundary and the three twin boundaries overlaid with α2 phase. 3G and 3H, Grain boundary color legend and distributions in maps 3E and 3F, respectively. 3I and 3J, Phase distributions. 3K and 3L, MAD distributions (back page).
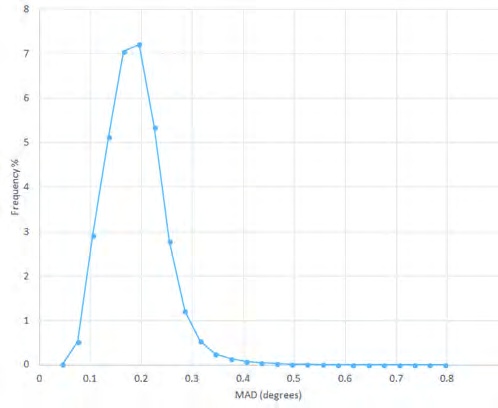
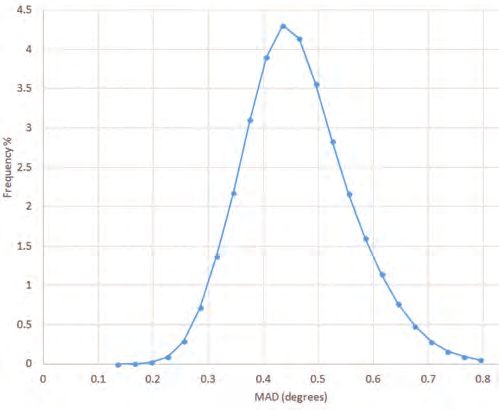
3K and 3L, MAD distributions.
Conclusion
The application of Refined Accuracy to solving pseudo-symmetry issues, a classic problem in EBSD, is very promising. It offers significant improvements in terms of orientation accuracy, but can also be employed in 'real-time' as the EBSD data is being collected. This offers significant benefits over other solutions which typically rely on super high Hough settings, which are both time consuming and require significant computer processing power.
Acknowledgements
Oxford Instruments thanks IMDEA Materials Institute, Madrid, Spain; Rolls-Royce; and UTC University of Cambridge, Cambridge, UK for their contribution to the poster at M&M 2015 from which this application note is derived.

